What Is A Candlestick?
A candlestick chart is a valuable tool in financial analysis, showing an asset’s high, low, open, and closing prices within a set time frame. Originally utilized by Japanese rice traders to track market prices and momentum, this type of chart later gained widespread use in the United States.
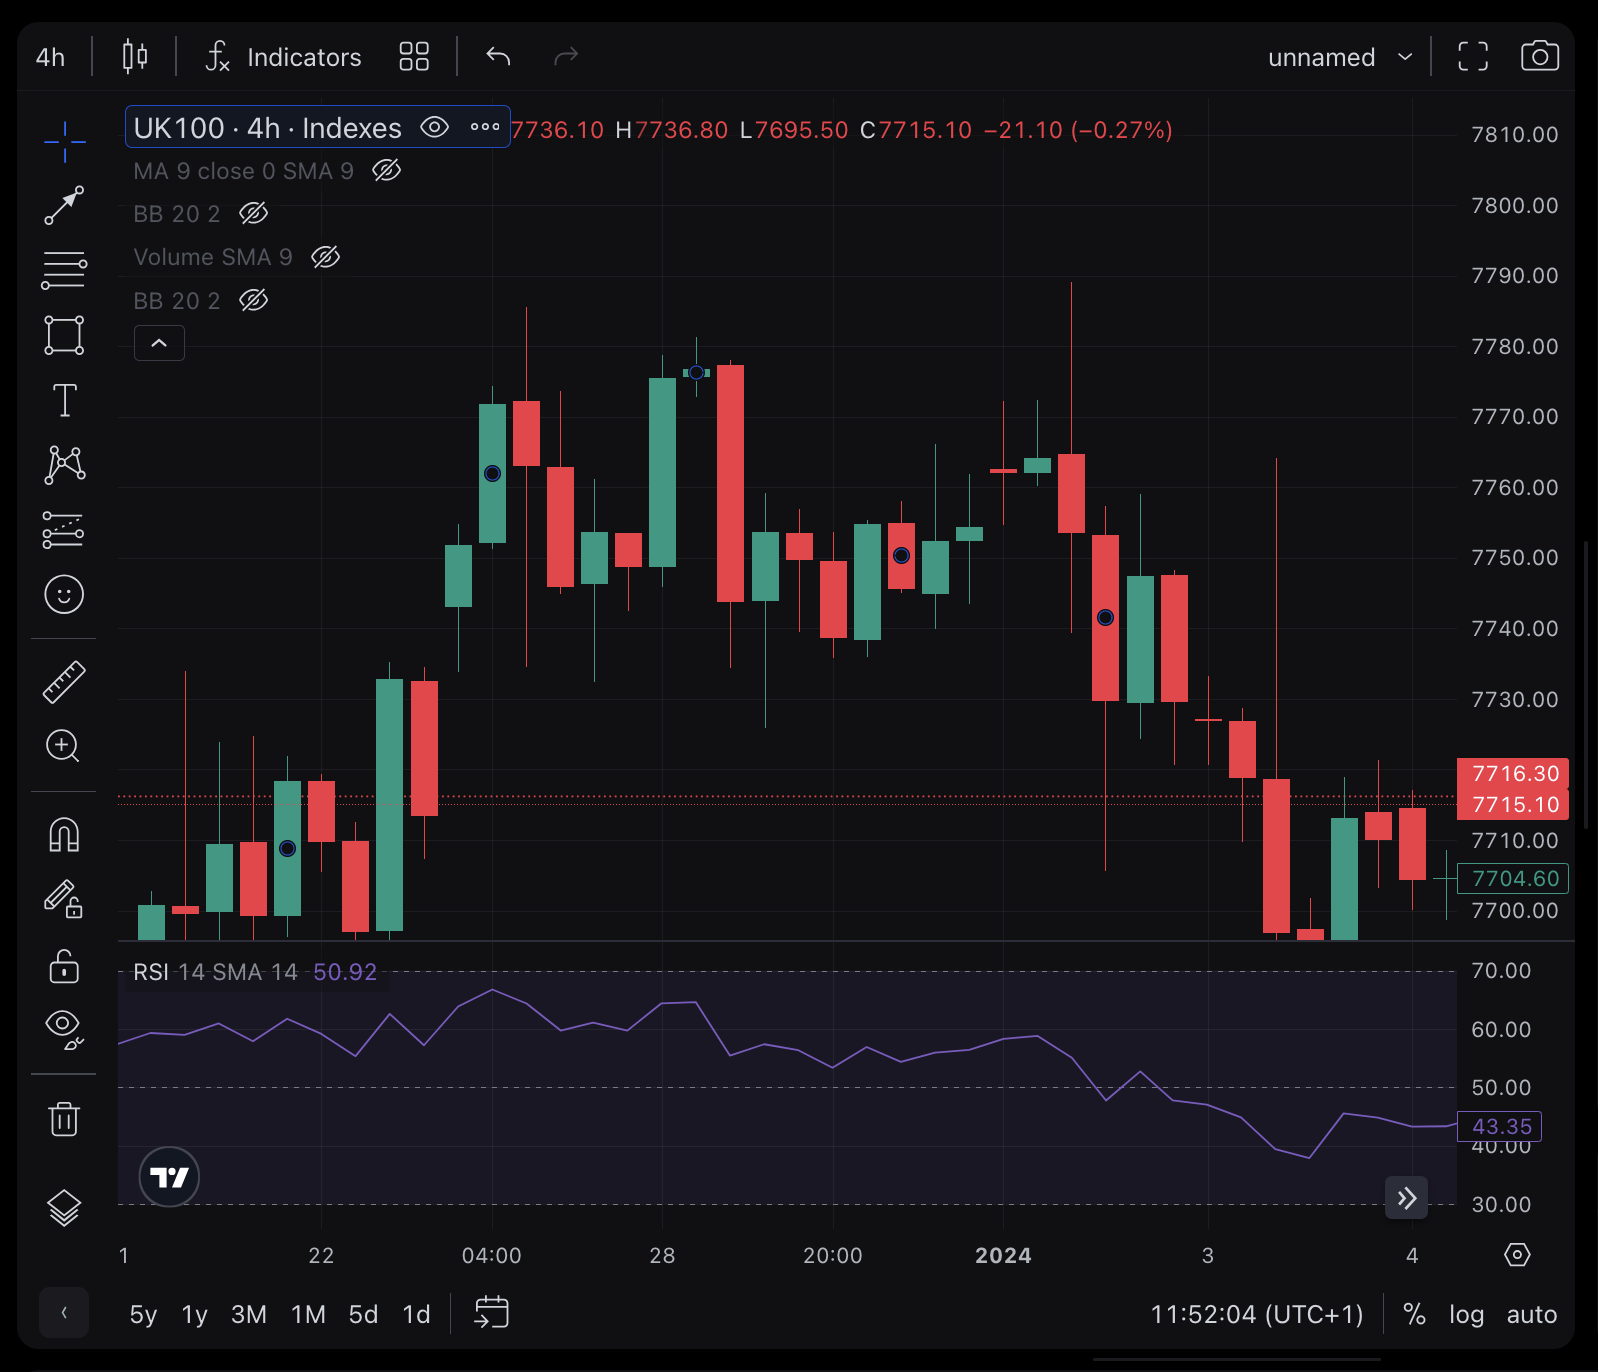
The key feature of a candlestick chart is its “real body,” which indicates the relationship between the closing and opening prices. The color coding of the real body helps in quick interpretation: typically, black or red is used to denote a closing price that is lower than the opening price, while white or green signifies a closing price that is higher than the opening. This visual representation makes it easier to understand market trends and patterns at a glance.
The Basics
The “shadows” on the candlestick represent the day’s high and low prices relative to the opening and closing prices. The shape of the candlestick changes based on these four key price points.
Candlestick charts help technical analysts decide when to buy or sell. Originating in 1700s Japan for rice price tracking, these charts are useful for trading a variety of liquid financial assets like stocks, forex, and futures.
Long white/green candlesticks signal strong buying pressure, typically indicating a bullish price movement. Their significance increases if they appear at key support levels. On the other hand, long black/red candlesticks reveal significant selling pressure, suggesting bearish price action. A “hammer” is a bullish reversal pattern that appears when the price drops significantly post-opening but rallies to close near the high. Its bearish counterpart is known as a “hanging man.”
Two-Day Candlestick Trading Patterns
Short-term trading tactics frequently use candlestick patterns to foresee market trends. The engulfing pattern, indicating a probable trend shift, is one such pattern where the second candlestick completely covers the first. A bullish engulfing pattern emerges at the end of a downtrend, while a bearish one appears at an uptrend’s peak. Another key reversal pattern is the harami, characterized by the second candlestick fitting entirely inside the first with a contrasting color. The “harami cross” variant features a doji as the second candlestick, where the opening and closing prices are almost identical, signaling market indecision and possible trend reversal.
Three-Day Candlestick Trading Patterns
The “evening star” pattern, indicating a bearish reversal, begins with a candlestick that continues an uptrend. The second candlestick in this pattern gaps up and has a small body. The third candlestick closes below the midpoint of the first. In contrast, the “morning star” is a bullish reversal pattern. It starts with a long, black/red candlestick, followed by a shorter one that gaps down. This pattern is completed by a long, white/green candlestick that closes above the midpoint of the first candlestick.