What Is Oversold?
Oversold is a term used to describe when an asset has traded at a lower price and has the potential for a price bounce. However, being oversold doesn’t guarantee that a price rally will come soon or at all. There are many technical indicators that can identify oversold and overbought levels, which assess where the price is currently trading relative to prior prices. Additionally, fundamentals can also be used to assess whether an asset is potentially oversold and has deviated from its typical value metrics.
What Does Oversold Tell You?
For fundamental traders, oversold means an asset is trading well below its typical value metrics. On the other hand, technical analysts are typically referring to an indicator reading when they mention oversold. Both approaches are valid, but they use different tools to determine if an asset is oversold.
Fundamentally Oversold
Fundamentally oversold assets, such as stocks, are those that investors feel are trading below their true value. This could be due to bad news regarding the company, a poor outlook for the company’s future, an out-of-favor industry, or a declining overall market. Traditionally, the price-to-earnings (P/E) ratio has been a common indicator of a stock’s value. Analysts and traders use publicly reported financial results or earnings estimates to determine the appropriate price for a particular stock. If a stock’s P/E ratio dips to the bottom of its historic range or falls below the average P/E ratio of the sector, investors may see the stock as undervalued. This presents a potential buying opportunity for long-term investing. However, careful analysis is required as there may be valid reasons why investors no longer have confidence in the company.
Technically Oversold
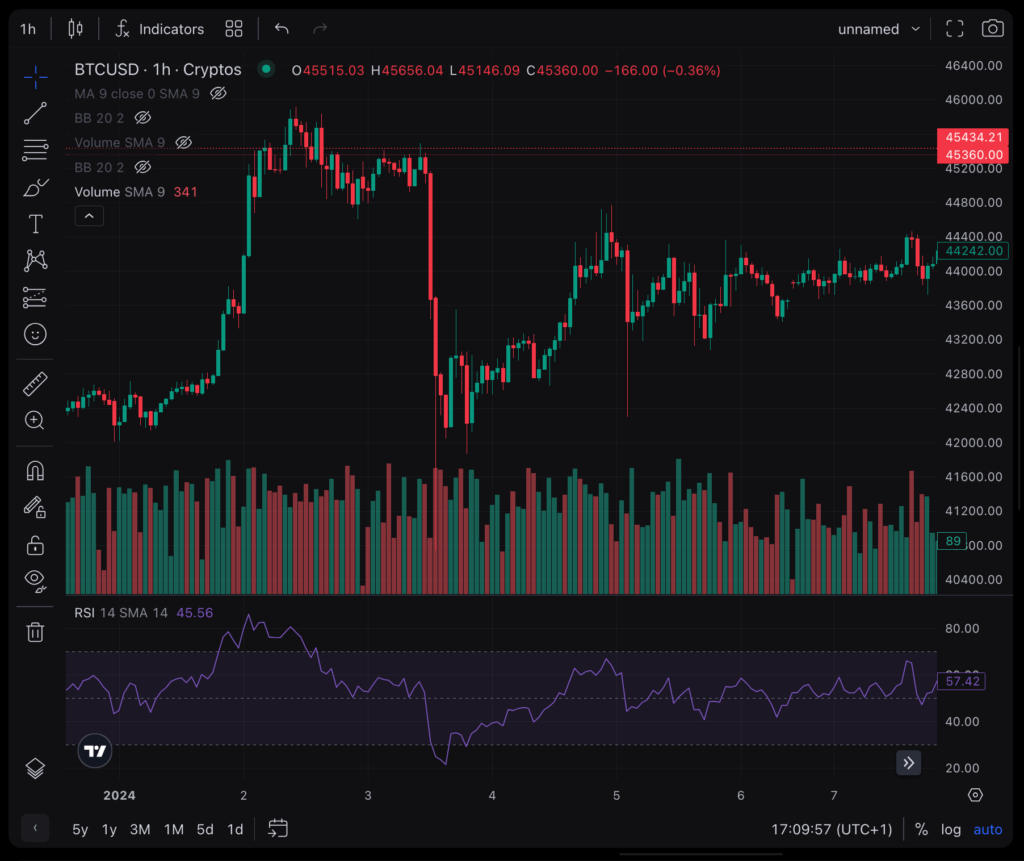
Traders can also use technical indicators to establish oversold levels. One example is George Lane’s stochastic oscillator, which examines recent price movements to identify changes in a stock’s momentum and price direction.
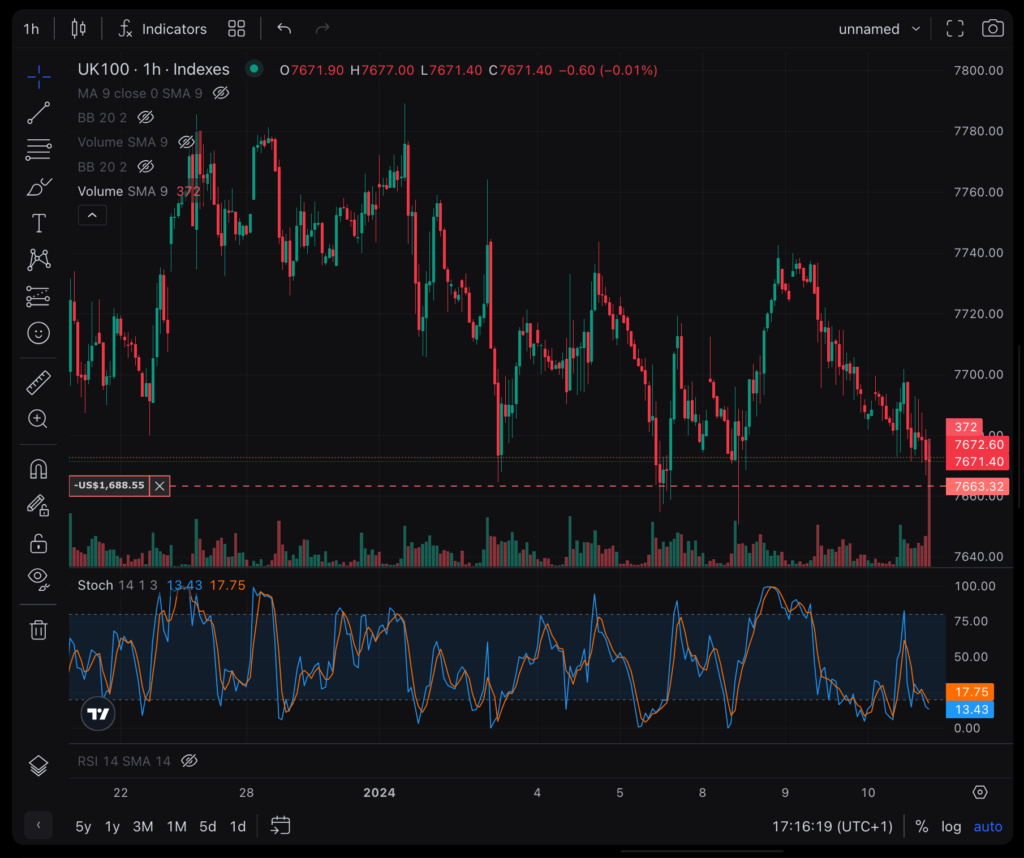
The relative strength index (RSI) measures the power behind price movements over a recent period. A low RSI, typically below 30, signals that a stock may be oversold. However, traders should not expect an immediate bounce in price as oversold conditions can persist for a long time. Many traders wait for the indicator to start heading higher before buying.
Some traders also use pricing channels like Bollinger Bands to spot oversold areas. Bollinger Bands are positioned at a multiple of a stock’s standard deviation above and below an exponential moving average. When the price reaches the lower band, it may be considered oversold. As with other technical indicators, traders usually wait for the price to start rising again before buying.
Examples of Oversold Indicators and Fundamentals
Charts can provide examples of oversold indicators and fundamentals. In the example chart, an RSI indicator and a P/E ratio are displayed. The arrows indicate instances where the RSI dropped below 30 and then moved back above it, suggesting a potential buy point based on recovery from an oversold condition. Some of these signals resulted in price increases, while others saw the price continue to decline for a while. The oversold level of the P/E ratio will vary by stock, as each stock has its own P/E range. Buying near a P/E of 10 represented a good buying opportunity for this stock as the price subsequently increased.
The Difference Between Oversold and Overbought
If oversold indicates that an asset is trading in the lower portion of its recent price range or is trading near lows based on fundamental data, then overbought is the opposite. An overbought technical indicator reading occurs when the price of an asset is trading in the upper portion of its recent price range. Similarly, an overbought fundamental reading occurs when the asset is trading at the high end of its fundamental ratios. Being overbought doesn’t necessarily mean the asset should be sold; it is simply an alert to investigate further.
Limitations of Using Oversold Readings
It is important to remember that oversold is not a buy signal, but rather an alert. It indicates that an asset is trading in the lower portion of its recent price range or at a lower fundamental ratio than usual. Just because an asset looks cheap based on historical standards does not mean it should be bought. Sometimes, stocks or other assets continue to decline even when they appear cheap based on past performance. If investors have a negative outlook for a stock, it may continue to be sold off regardless of its oversold status. Even if an asset is a good buy, it may remain oversold for a significant period before the price begins to rise. Therefore, many traders watch for oversold readings but wait for the price to start moving up before making a decision based on the oversold signal.