The Relative Strength Index (RSI) is a momentum oscillator that measures the speed and change of price movements. Developed by J. Welles Wilder Jr., it oscillates between 0 and 100 and is most commonly used with a 14‑period lookback. Traders use it to spot overbought or oversold conditions, gauge trend strength, and identify potential reversals.
How RSI Is Calculated
1. Price Change
$$\Delta P_t = P_t – P_{t-1}$$
2. Separate Gains and Losses
$$U_t = \max(\Delta P_t, 0)\qquad
D_t = -\min(\Delta P_t, 0)$$
3. Average Gain & Average Loss (14‑period SMA)
$$\overline{U}_t = \frac{1}{14}\sum_{i=0}^{13}U_{\,t-i}
\quad\qquad
\overline{D}_t = \frac{1}{14}\sum_{i=0}^{13}D_{\,t-i}$$
4. Relative Strength (RS)
$$\mathrm{RS}_t = \frac{\overline{U}_t}{\overline{D}_t}$$
5. Relative Strength Index
$$\mathrm{RSI}_t = 100 \;-\; \frac{100}{1 + \mathrm{RS}_t}$$
By construction, RSI values above 70 typically signal overbought conditions, while readings below 30 point to oversold territory.
Interpreting RSI for Forex & Indices
Because forex and major indices often trend for extended periods, the RSI can stay in overbought/oversold zones longer than you’d expect. For intermediate traders:
-
Trend Confirmation
In a strong uptrend, RSI may hover between 40–80. Look for pullback entries near 40–50 rather than waiting for a dip to 30. -
Divergence
When price makes a higher high but RSI makes a lower high (bearish divergence), a reversal or deeper pullback might be brewing. -
Range Trading
On slow-moving currency pairs or an index in a range, standard 70/30 thresholds can work nicely—sell near RSI 70 and buy near 30.
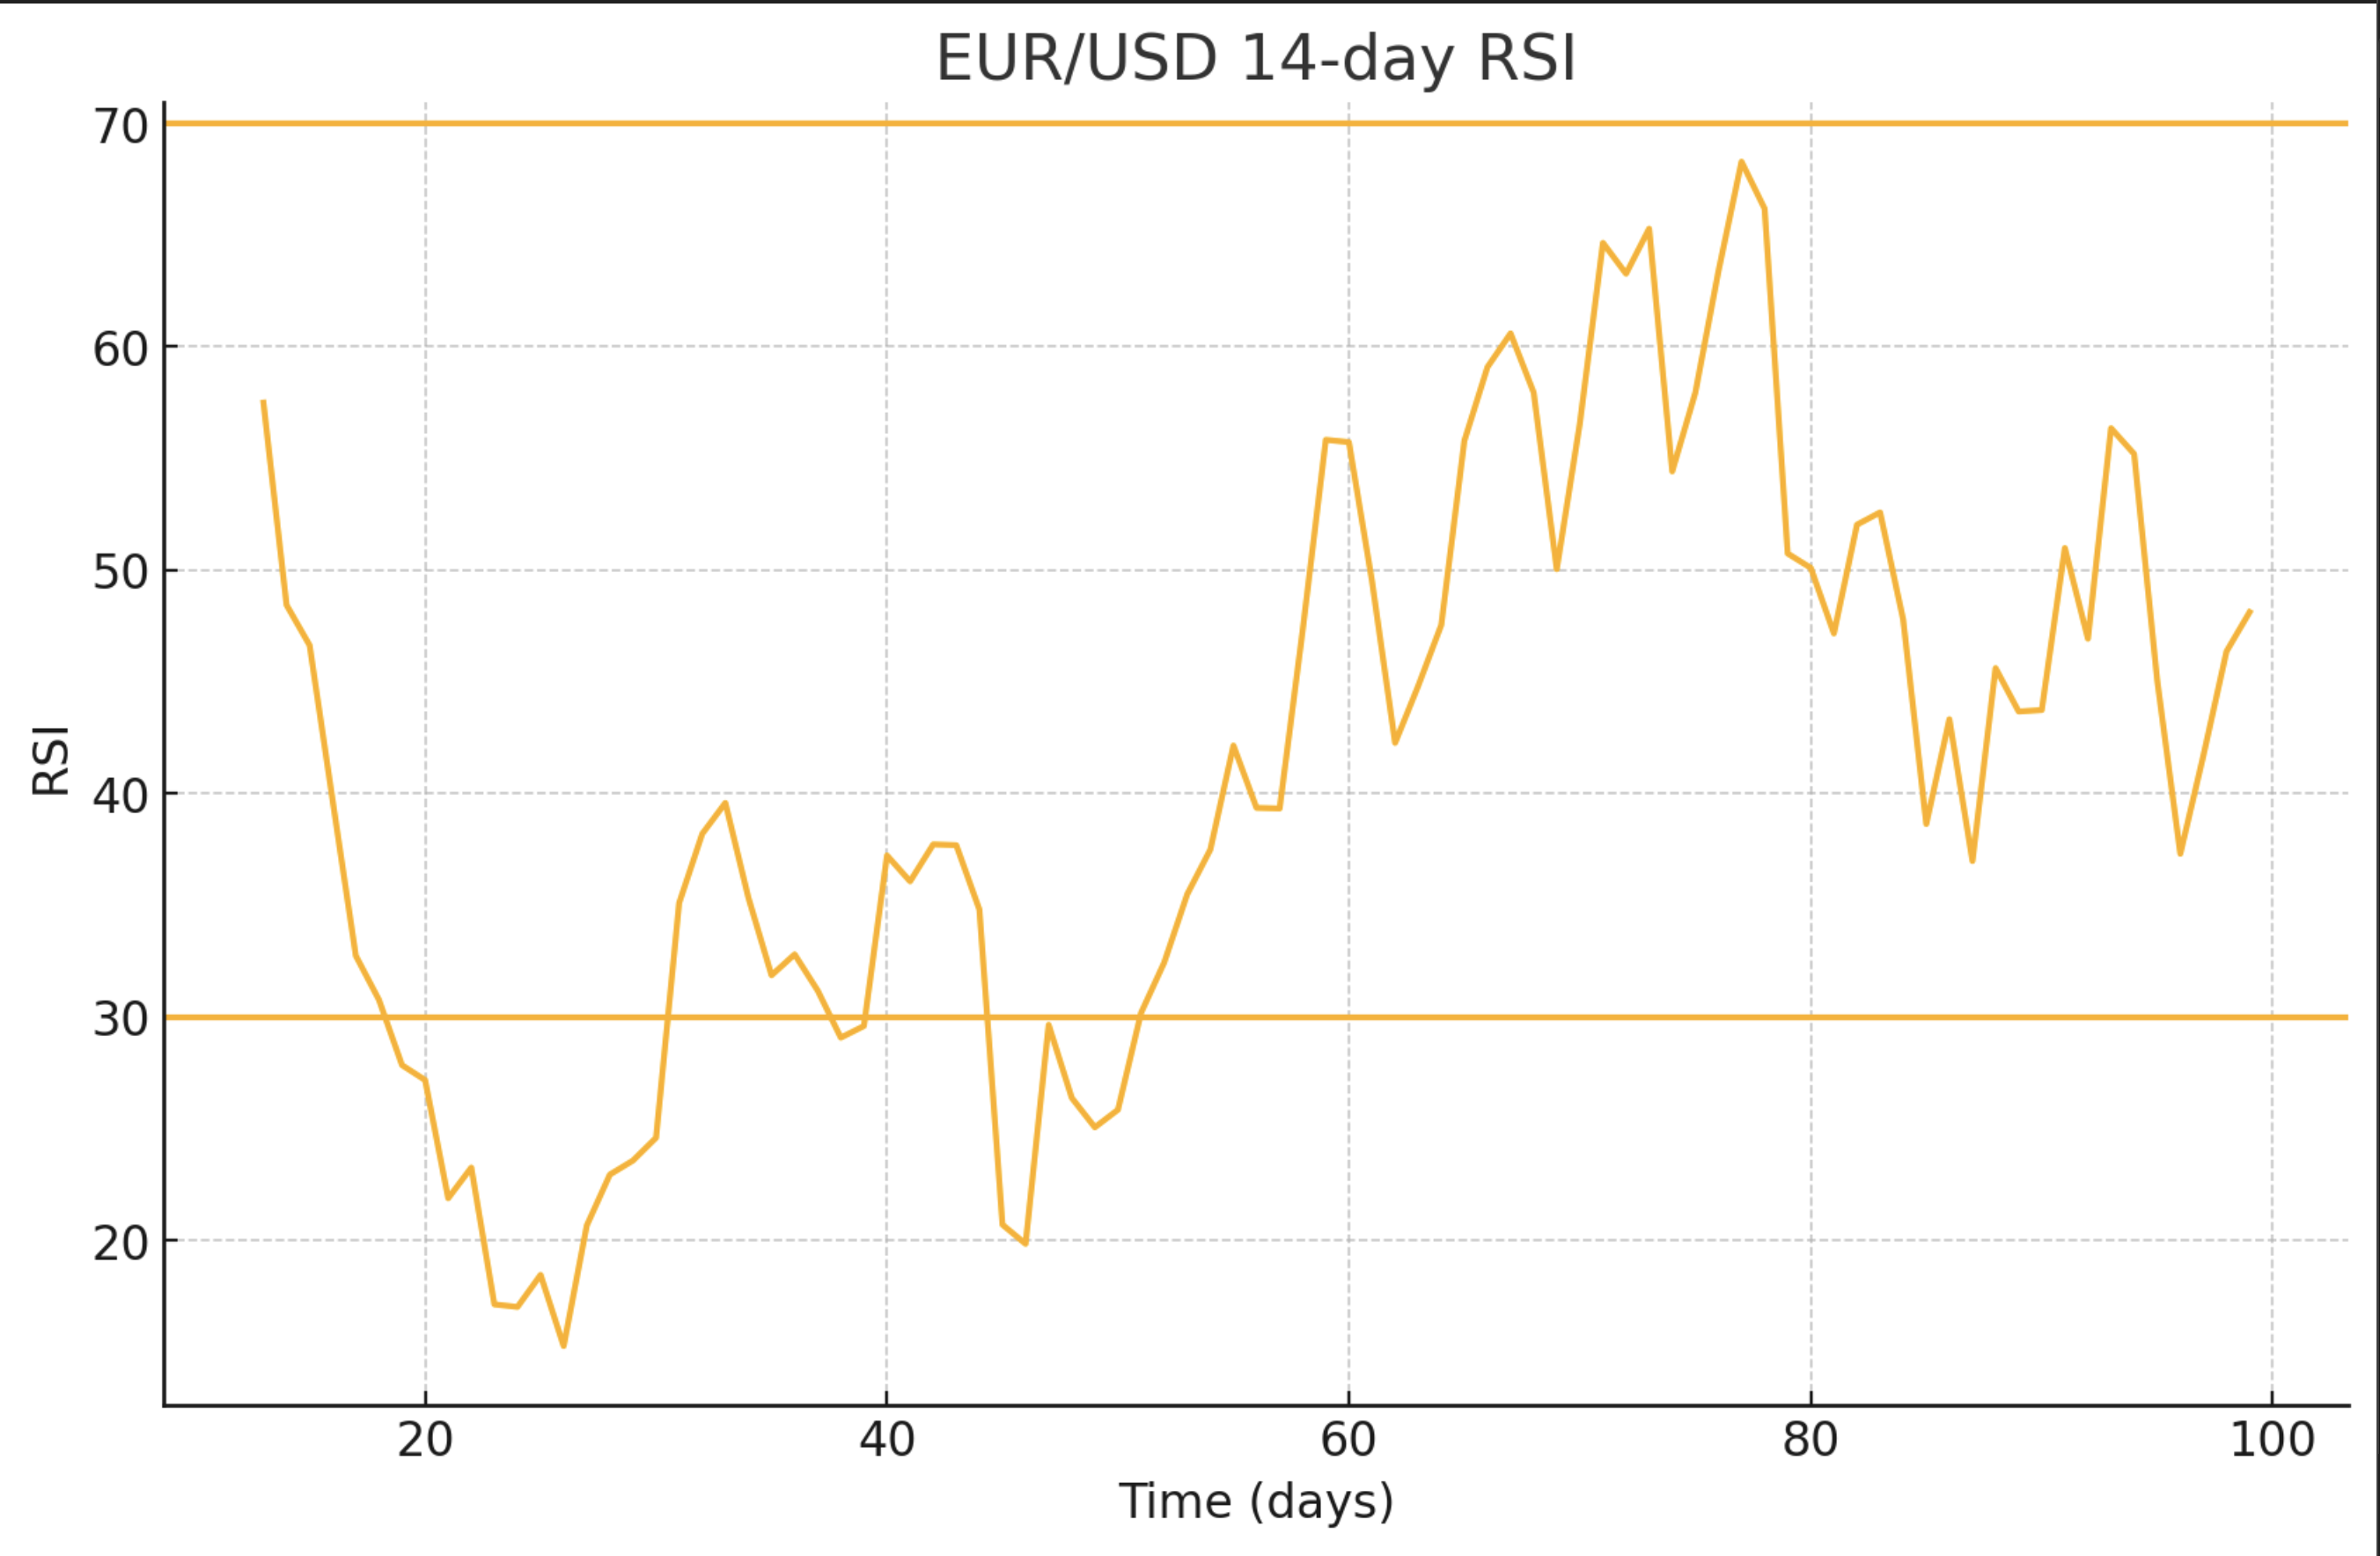
EUR/USD
Below is the 14‑day RSI calculated on a sample EUR/USD price series.
The chart plots RSI values across 100 time steps. Notice how readings dip below 30 around day 25 (potential buy zone) and push above 70 around day 70 (potential sell zone).
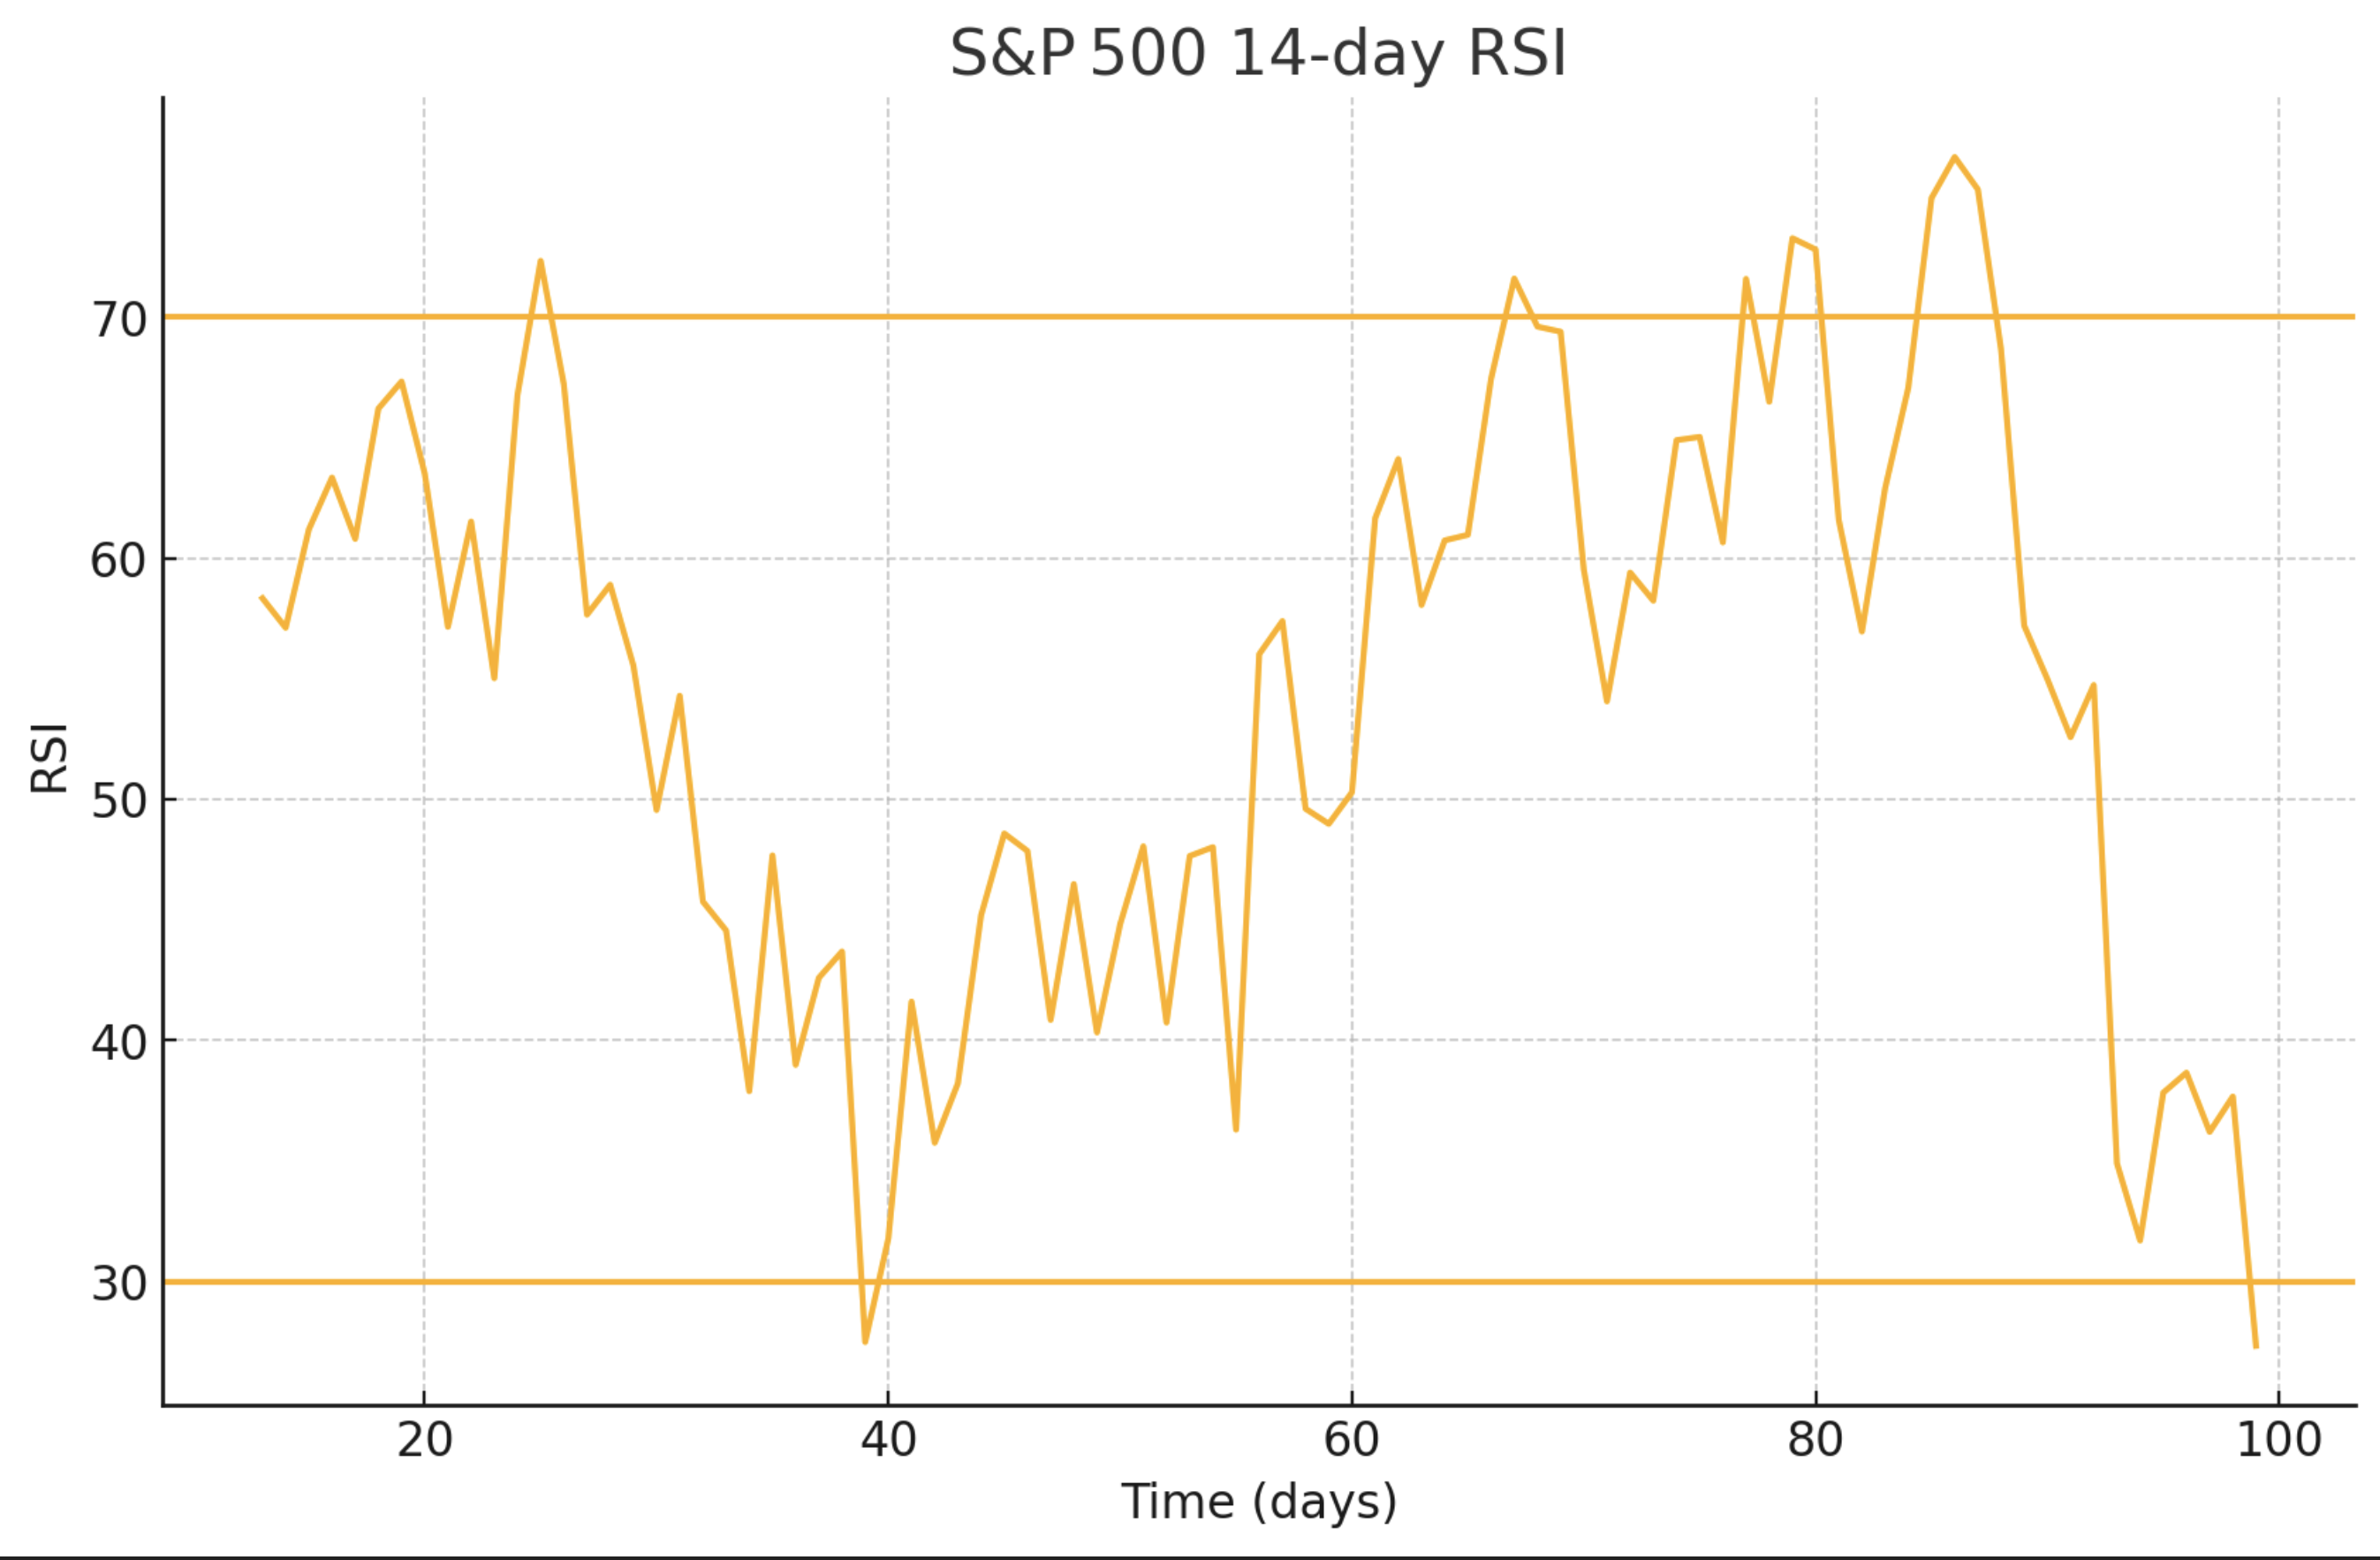
S&P 500 14‑Day RSI
Here’s the same 14‑period RSI on a simulated S&P 500 series.
Note how extended rallies keep RSI above 50, and deep pullbacks push it near 30—ideal spots for range‑bound entries or trend‑continuation trades.
Practical Strategies
-
RSI Pullback Entry (Trend‑Following)
-
Identify a clear trend on higher timeframes.
-
Wait for RSI to retrace to around 40–50 (in an uptrend) or 50–60 (in a downtrend).
-
Enter in the direction of the trend once RSI bounces off that zone.
-
-
Classic Overbought/Oversold
-
In choppy markets, short when RSI > 70 and price shows bearish candlestick signals.
-
Go long when RSI < 30 and price forms a bullish reversal pattern.
-
-
Divergence Trading
-
Draw trendlines on price and RSI.
-
When they clash (e.g., price makes lower low but RSI makes higher low), prepare for a reversal or strong counter‑trend move.
-
Tips & Pitfalls
-
False Signals: RSI can whip back and forth in volatile sessions—combine it with support/resistance or candlestick patterns.
-
Adjust Period: If RSI feels too jumpy, try a longer lookback (e.g., 21). For quicker signals, try 9.
-
Multi‑Timeframe: Check RSI on your main timeframe and one higher to confirm overbought/oversold zones.
Wrapping Up
RSI is a versatile tool for both forex and index traders. It’s simple to compute, gives clear overbought/oversold cues, and can highlight hidden divergences. To master it, practice plotting RSI alongside price on your favorite pairs and indices, adjust your thresholds, and always combine it with price‑action or trend analysis. With time, you’ll spot setups that fit your trading style—and ride those momentum waves more confidently.