Identifying and Using Support Zones
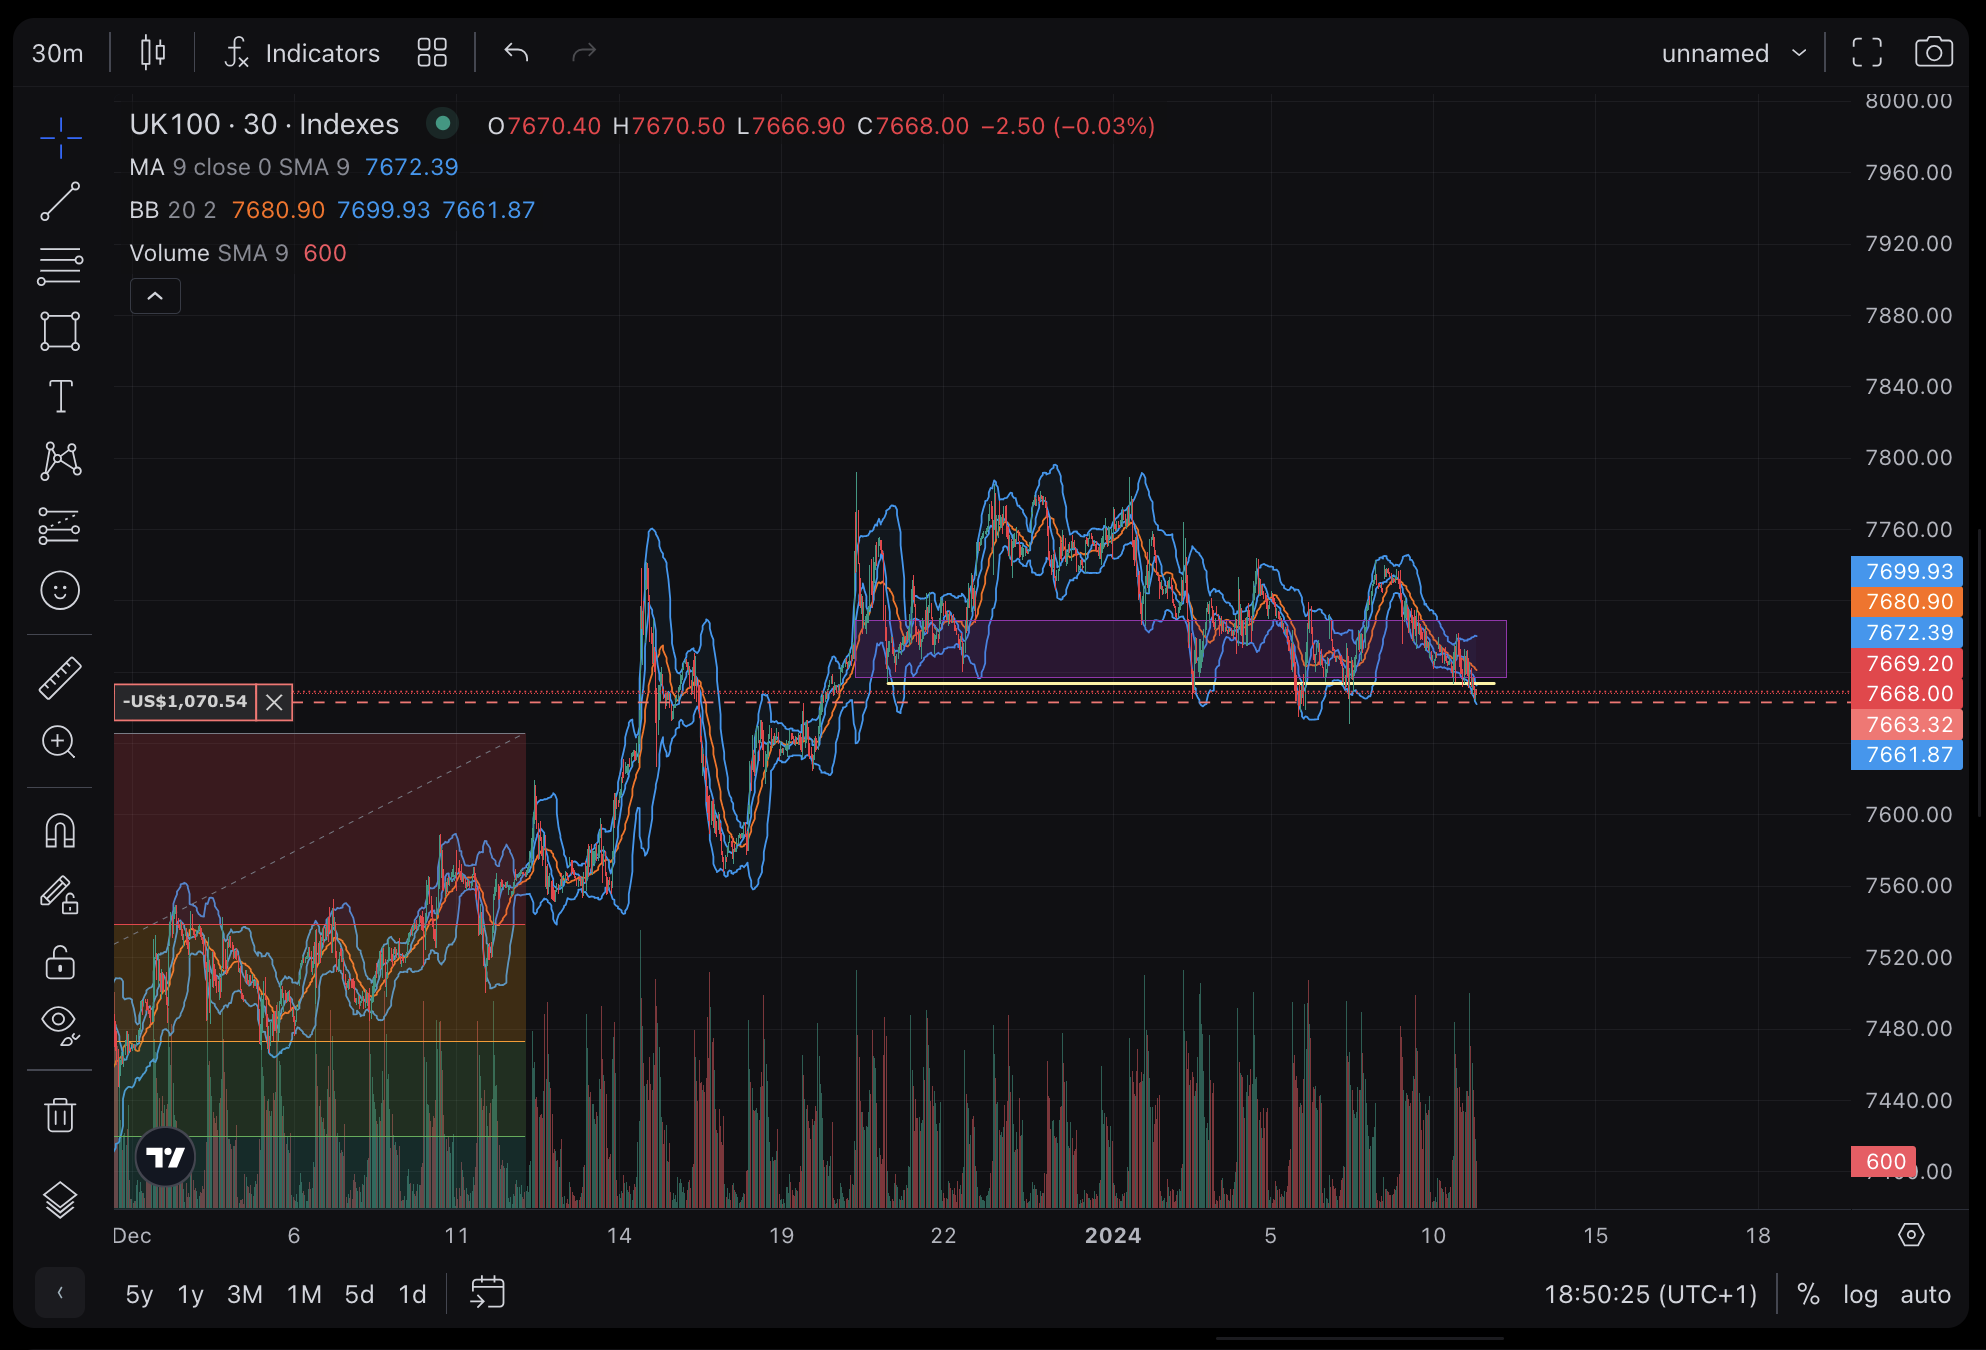
The zone of support is a critical concept in day trading, representing a price range where a security’s price historically finds support, stopping further declines. Traders often look to buy near this zone, expecting the price to bounce back, and set stop-loss orders just below it to manage risk. Tools like trendlines, which connect price lows, and moving averages, such as the 50-day or 200-day, help identify these zones dynamically. Fibonacci retracement, based on ratios like 38.2% or 61.8%, and volume profile, showing high trading activity areas, are also effective. Pivot points, calculated from the previous day’s high, low, and close, offer daily support levels. Confirming with indicators like RSI or MACD can enhance decision-making.
Predicting Breakouts
Predicting breakouts, where the price moves below the support zone, involves strategies like volume analysis—high volume on a break suggests a genuine move. The opening range breakout strategy, focusing on the first few minutes of trading, can confirm breakouts if near support. Candlestick patterns, such as bearish engulfing, and momentum indicators like RSI, help gauge potential breaks, though success depends on market conditions.
Introduction to Zone of Support
The zone of support is a fundamental concept in technical analysis, particularly relevant for day traders. It refers to a price range where a security’s price has historically found sufficient demand to prevent further declines, acting as a “floor” for price movement. Unlike a precise support level, a support zone acknowledges the fluidity of market dynamics, encompassing a range rather than a single point. This range is identified through historical price data, where the security has previously reversed from declines, making it a high-probability area for price reversals or continuations.
Zone of Support defines as a lower boundary the stock has not easily breached, providing areas where traders might expect reversals. This concept is crucial for day trading, where quick decisions based on short-term price movements are essential, and understanding these zones can enhance trading strategies.
Tools and Techniques
Identifying support zones requires a combination of technical tools, each offering unique insights into market behavior. The following table summarizes the primary tools and their applications:
| Tool | Description | Application in Day Trading |
|---|---|---|
| Trendlines | Lines drawn connecting price lows, acting as dynamic support levels. | Useful for visualizing trends; buy signals near upward-sloping trendlines. |
| Moving Averages | Smooth averages of past prices (e.g., 50-day, 200-day) that can act as support in uptrends. | Acts as dynamic support; confirm with price above moving average for buys. |
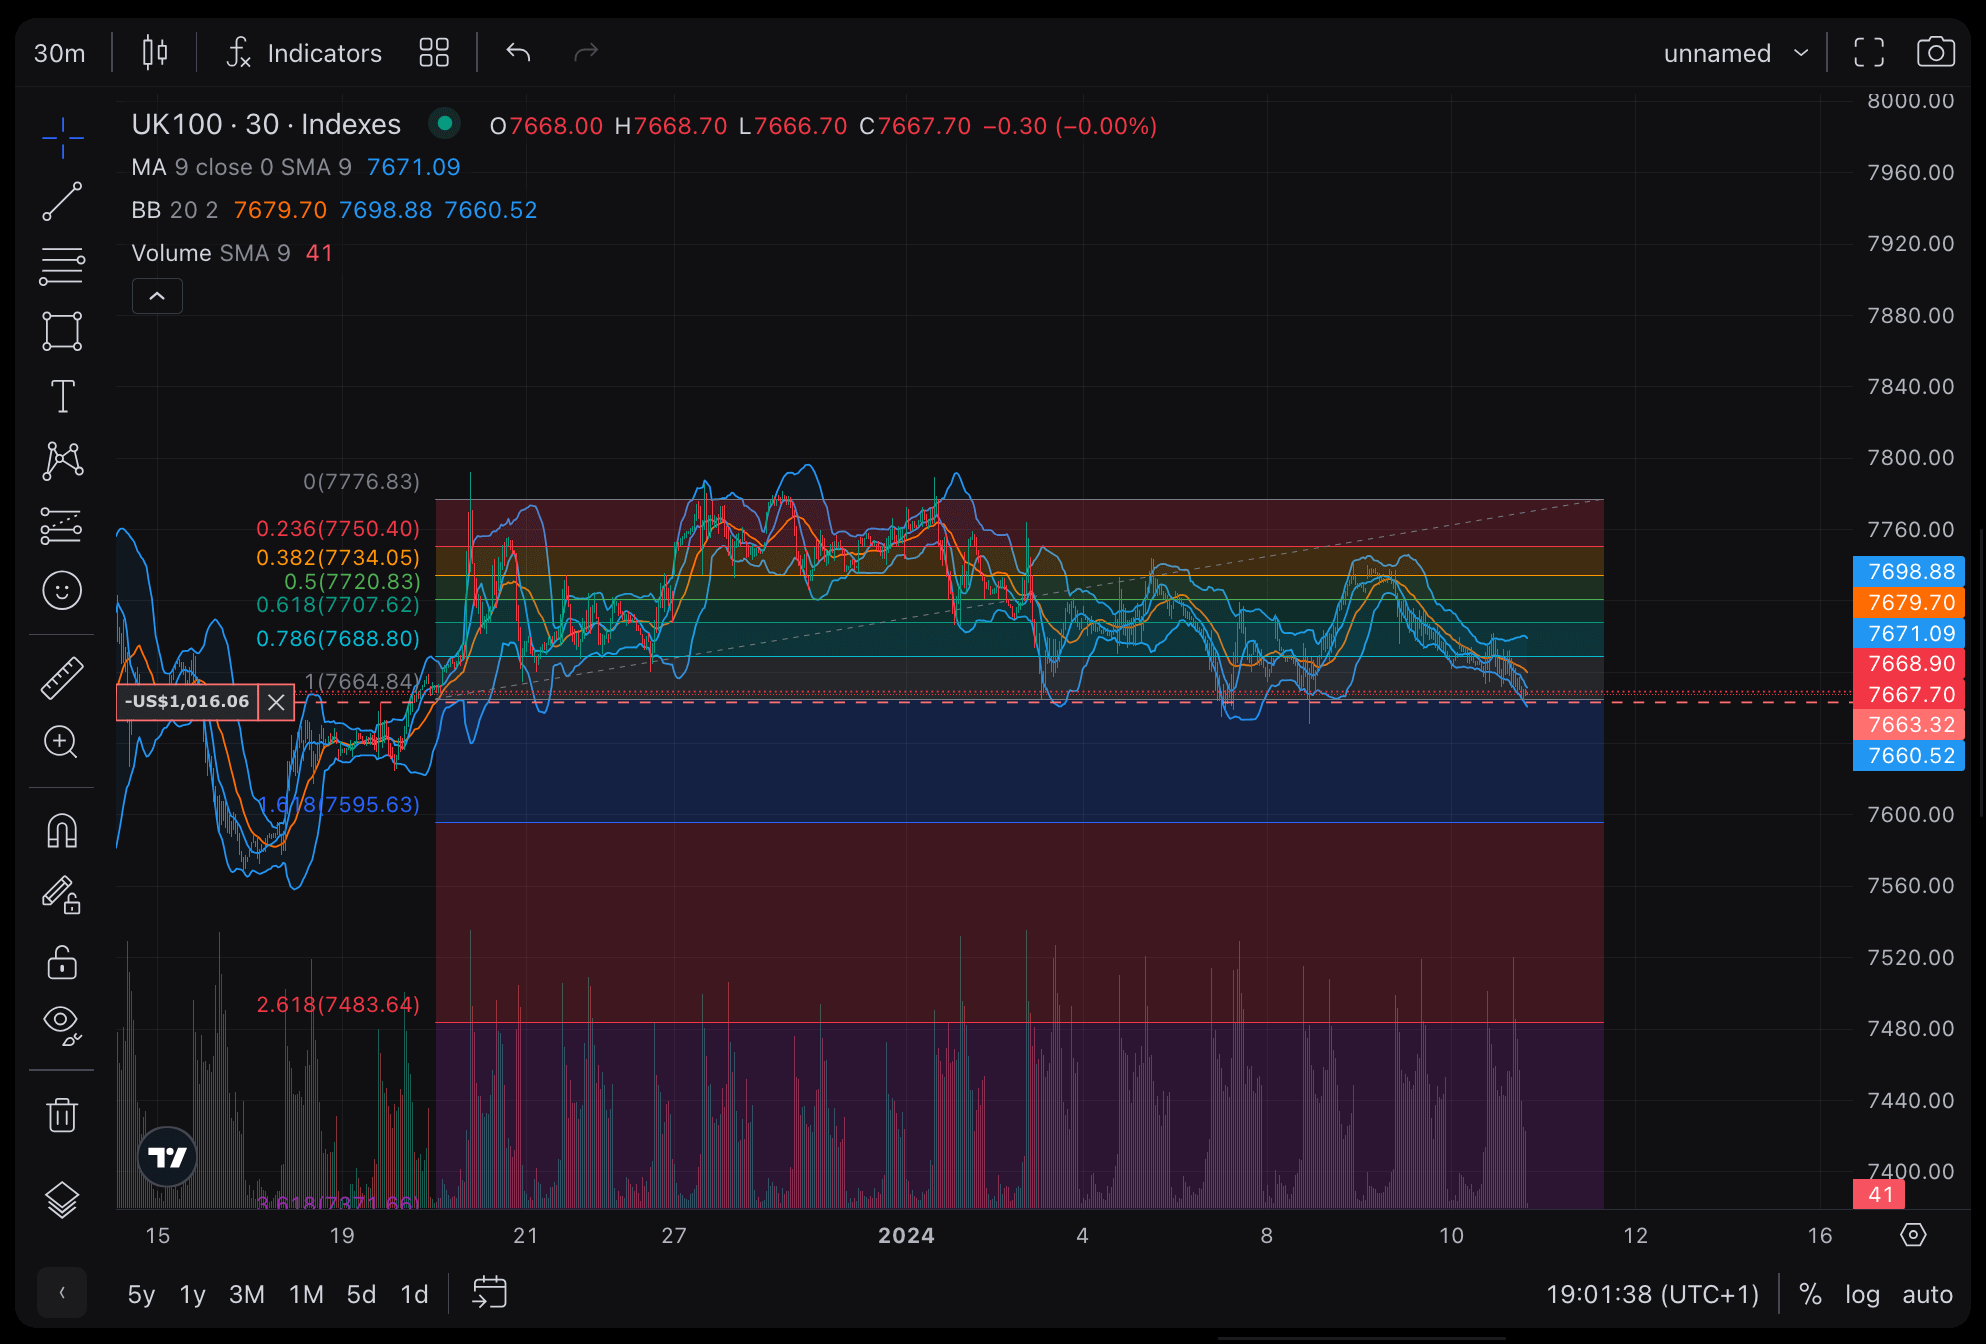
| Fibonacci Retracement | Identifies potential support levels using ratios like 38.2%, 50%, 61.8% during corrections. | Set entry points at key levels; popular among short-term traders, as noted on Bitcoin Magazine Pro: TradingView Indicators. |
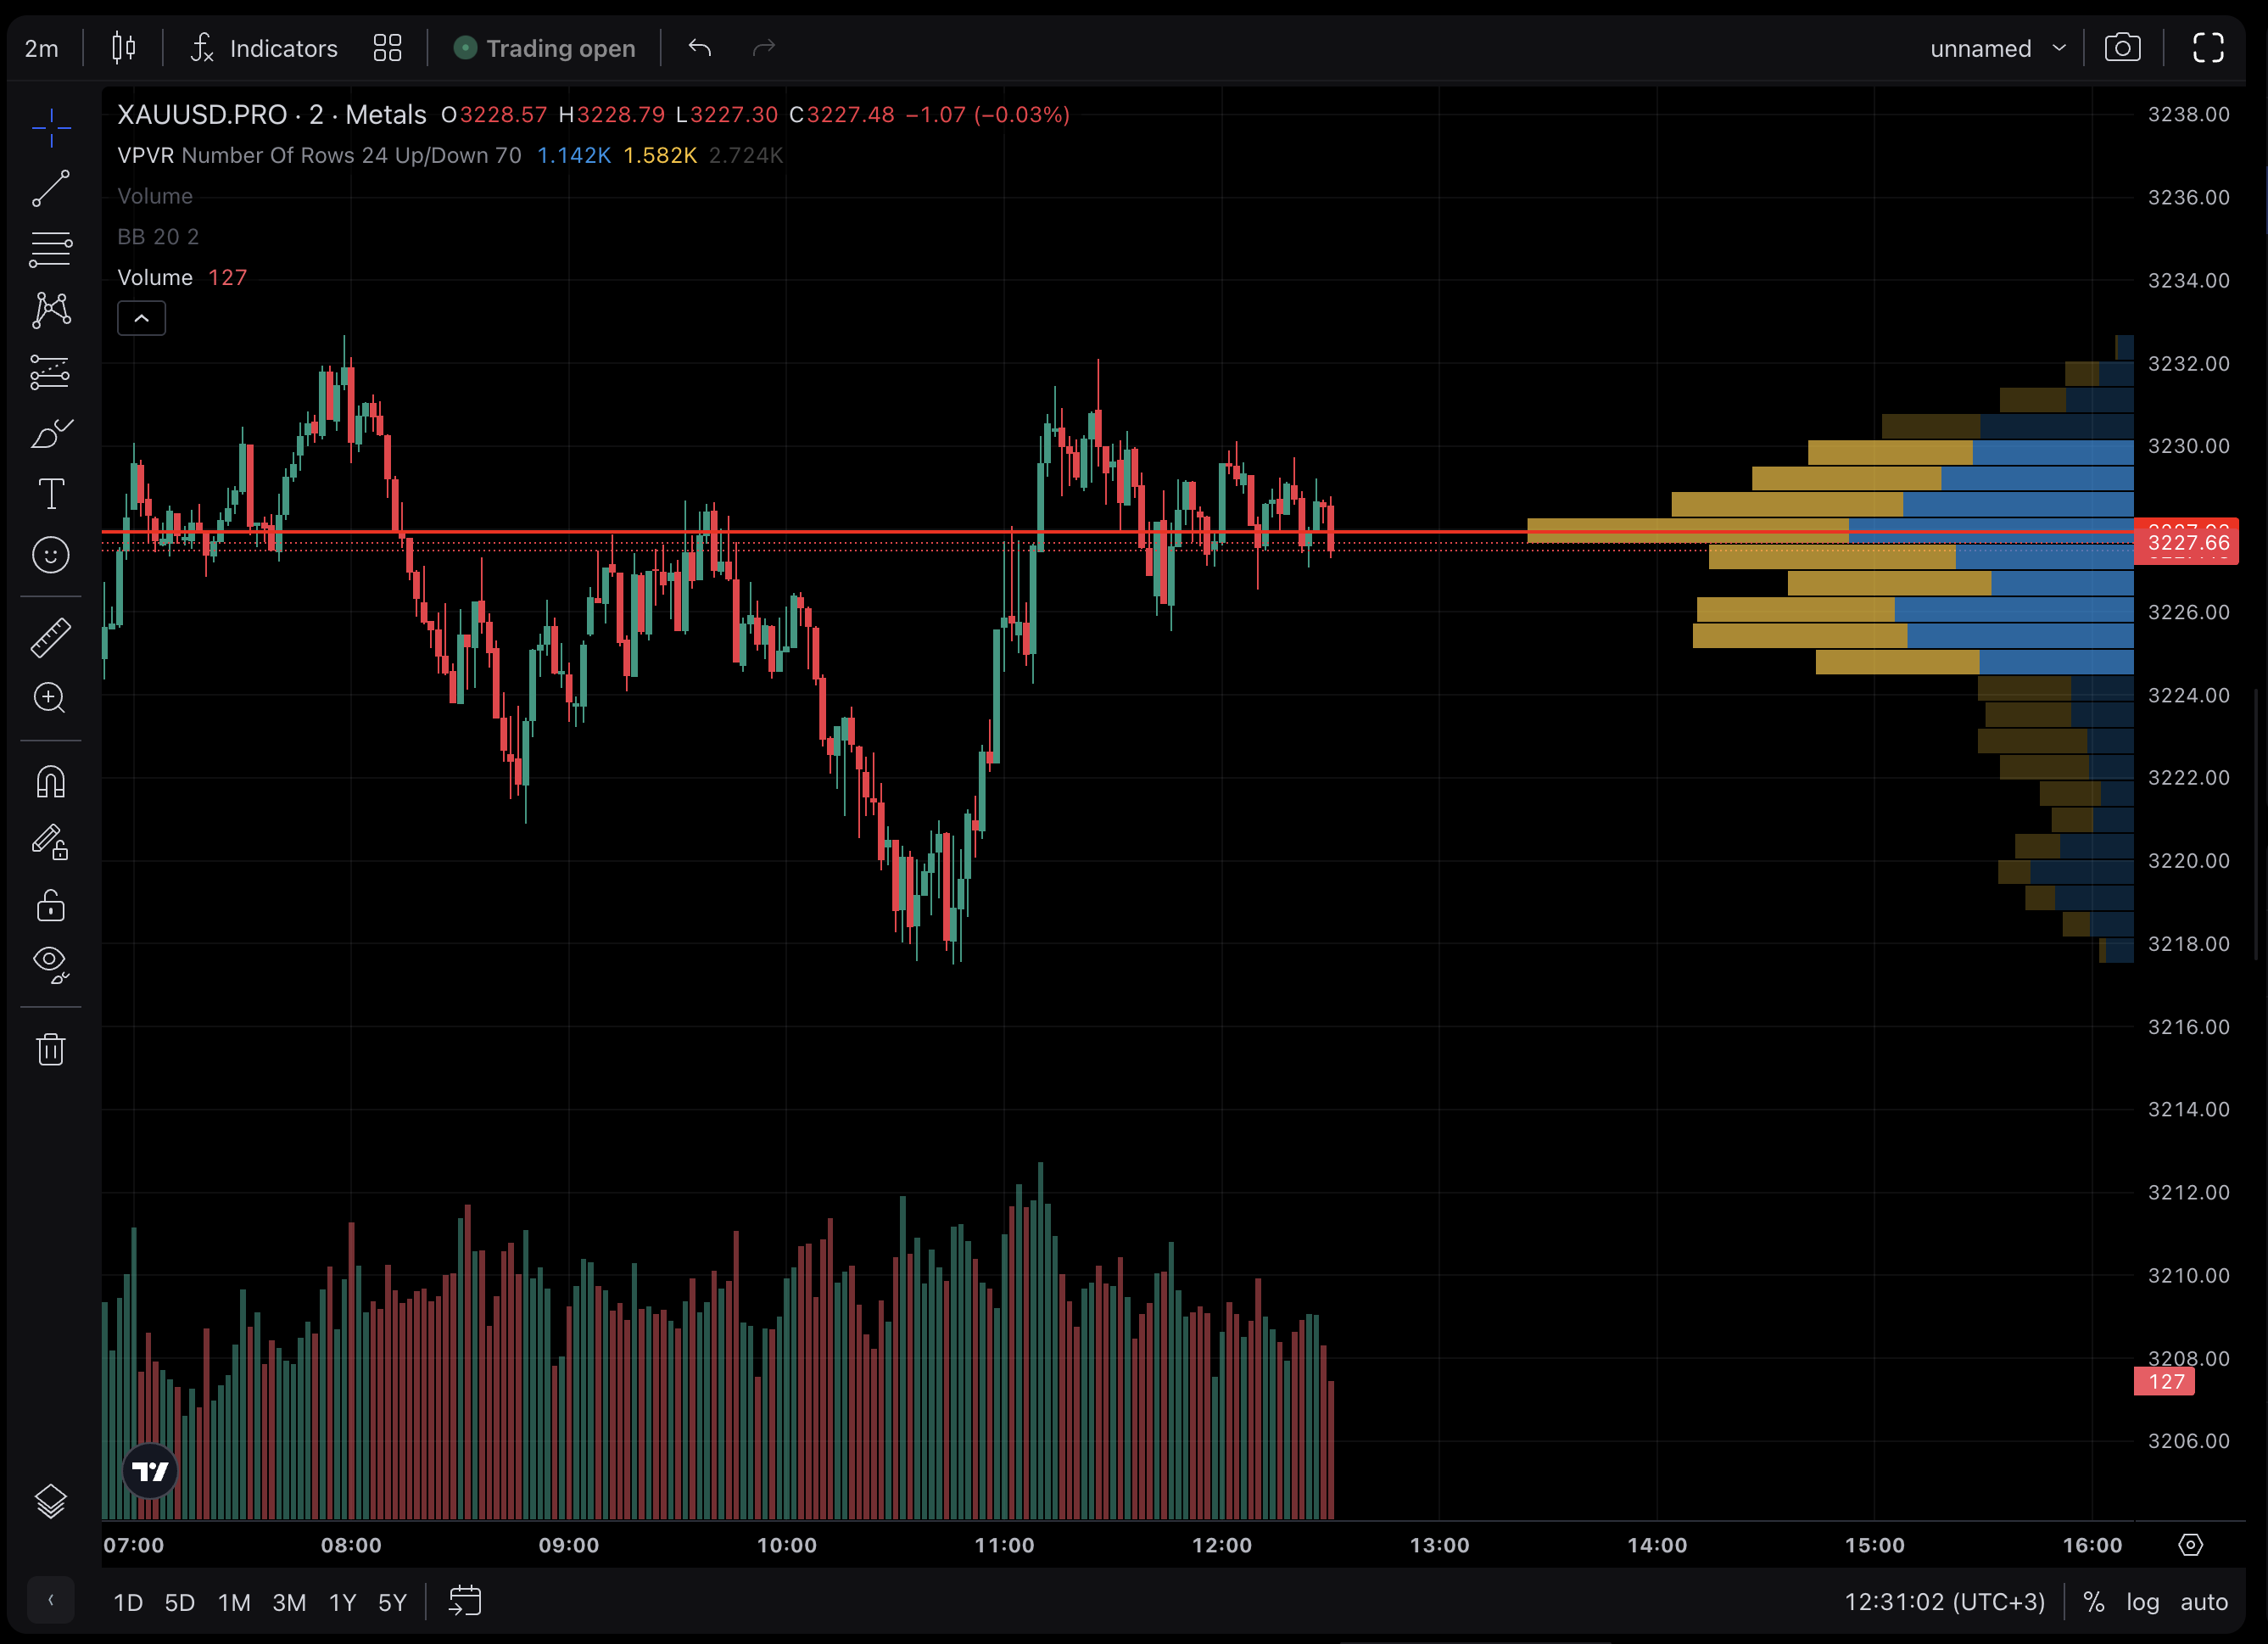
| Volume Profile | Shows volume traded at each price level, highlighting high-volume nodes (HVN) as support areas. | Identifies areas of strong support; HVNs act as support in uptrends, per TradingSim: Volume Profile Strategies. |
| Pivot Points | Calculated from previous day’s high, low, and close, providing daily support levels. | Offers intraday levels; useful for quick decisions, as seen on TradingView: Support and Resistance. |
These tools are not mutually exclusive; traders often combine them for confluence. For instance, a support zone identified by a Fibonacci level near a high-volume node can be more reliable. The choice of tool may depend on the trader’s style and the asset’s volatility, with volume profile being particularly effective for day trading due to its focus on intraday activity.
Practical Strategies
Once identified, support zones serve multiple purposes in day trading. Traders typically use them for entry points, risk management, and trade confirmation. Here are the key strategies:
- Buying Opportunities: Traders often enter long positions near the support zone, expecting a price bounce. For example, if a stock approaches a support zone identified by a 50% Fibonacci retracement and is above its 50-day moving average, it may signal a buying opportunity.
- Stop-Loss Placement: To manage risk, traders place stop-loss orders just below the support zone. If the price breaks below, it suggests the support failed, and the trade should be exited to limit losses.
- Confirmation with Indicators: Additional indicators like the Relative Strength Index (RSI) or Moving Average Convergence Divergence (MACD) can confirm buying signals. For instance, an RSI above 30 near support might indicate oversold conditions, supporting a long entry.
These strategies are supported by resources like Investopedia: Support and Resistance Basics, which emphasize the importance of discipline in setting reasonable buy and sell prices. However, traders must be aware that support zones are based on past price action and do not guarantee future movements, requiring flexibility and risk management.
Advanced Techniques
A breakout occurs when the price moves below the support zone, potentially signaling a continuation of a downtrend or a false breakout that reverses. Predicting these breakouts is crucial for day traders to capitalize on significant moves or avoid false signals. Several strategies and tools can aid in this process:
- Volume Analysis: A breakout accompanied by high trading volume is more likely to be genuine. For example, if the price breaks below a support zone with a spike in volume, it suggests strong selling interest, as noted in Earn2Trade Blog: Trading Breakouts and Breakdowns. Conversely, low volume might indicate a false breakout.
- Opening Range Breakout (ORB) Strategy: This strategy involves identifying the high and low of the first few minutes (e.g., 5, 15, or 30 minutes) after the market opens and trading the breakout. If the opening range is near a support zone and the price breaks below, it can confirm a breakout. Resources like Warrior Trading: Opening Range Breakout highlight its effectiveness for day traders, with examples showing how the first hour sets the day’s trend.
- Candlestick Patterns: Patterns like bearish engulfing, where a large bearish candle follows a smaller bullish one, or breakdowns from consolidation, can signal potential breakouts. These patterns, discussed in Real Trading: Day Trading Support and Resistance, help traders anticipate price moves based on price action.
- Momentum Indicators: Indicators such as RSI or the stochastic oscillator can gauge whether the market is oversold or has enough momentum for a breakout. For instance, an RSI below 30 with a break below support might suggest continued downward momentum, as seen in TradingView: Volume Indicator.
These techniques are not foolproof, and breakouts can fail, especially in efficient markets. Traders must combine multiple signals for confluence and use stop-loss orders to manage risk, as breakouts can lead to significant losses if misjudged.
Conclusion and Practical Considerations
The zone of support is a vital tool for day traders, enabling them to identify potential buying opportunities and manage risk effectively. By leveraging tools like trendlines, moving averages, Fibonacci retracement, volume profile, and pivot points, traders can pinpoint these zones with high accuracy. Strategies for using support zones, such as buying near the zone and setting stop-losses below, enhance trading decisions, while predicting breakouts using volume analysis, ORB, candlestick patterns, and momentum indicators can capitalize on significant price moves.
However, traders must remain aware that all technical analysis is based on past price action, offering no guarantees for future movements. The choice of tools and strategies should align with the trader’s experience, asset volatility, and market conditions. For further reading, resources like DayTradingZones offer specialized tools, though some are paid services, and free platforms like TradingView provide a wealth of indicators, as seen in TradingView: Support and Resistance Indicators.
This comprehensive approach ensures traders can navigate the complexities of day trading, leveraging support zones to stack probabilities of success while maintaining realistic expectations about risk.
Key Citations
- Investopedia Zone of Support Definition
- Investopedia Support and Resistance Basics
- TradingSim Advanced Day Trading Volume Profile
- Warrior Trading Opening Range Breakout Strategy
- Bitcoin Magazine Pro TradingView Indicators
- Earn2Trade Blog Trading Breakouts Breakdowns
- Real Trading Day Trading Support Resistance
- TradingView Volume Indicator Details
- TradingView Support and Resistance Scripts
- DayTradingZones Trading Platform Overview