What is the VIX?
Volatility Index, is a real-time index that reflects the market’s expectation of volatility over the next 30 days, based on S&P 500 index options prices. It’s widely recognized as a measure of market risk and investor sentiment, often dubbed the “fear index” (CBOE VIX Index).
How to Use
Traders interpret Volatility Index levels to understand market mood. Generally, a high Volatility Index (above 30) suggests high volatility and fear, often during market declines, while a low VIX (below 15) indicates stability and optimism. Levels between 15-25 show moderate volatility, and 25-30 signal increasing turbulence (Understanding VIX or Volatility Index – TD Bank). Traders can use Volatility Index to hedge portfolios or speculate using derivatives like futures, options, ETFs, and ETNs, leveraging its inverse correlation with the S&P 500.
Tools
You can access current VIX values on financial websites like Yahoo Finance or Bloomberg, and directly on the CBOE website. Trading platforms such as Thinkorswim or Interactive Brokers also provide real-time data, with historical data available on the CBOE site for deeper analysis.
Predicting Breakouts
Predicting significant Volatility Index movements involves technical analysis, using tools like moving averages, Bollinger Bands, and RSI on platforms like TradingView. Analyzing the VIX futures term structure, available on the CBOE website, can indicate market expectations, with backwardation suggesting potential volatility spikes and contango stability. Results can vary, so combine with historical analysis for better insights.
Introduction to the VIX
The Volatility Index, introduced by the Chicago Board Options Exchange (CBOE) in 1993, is a real-time index designed to measure the market’s expectation of 30-day forward-looking volatility, derived from the mid-quote prices of S&P 500 Index (SPX) call and put options (CBOE VIX Index). It is one of the most recognized measures globally, widely reported by financial media and closely followed by market participants as a daily indicator of market risk and sentiment, often referred to as the “fear index” due to its correlation with market fear during turbulent times.

Check the value on TradingView. Related products include Volatility Index futures and options, part of CBOE’s volatility franchise, offering traders additional instruments for exposure.
Utilization of VIX
Traders leverage the Volatility Index to gauge market sentiment, with its levels providing insights into expected volatility. Research suggests the following interpretations based on VIX values:
- 0-15: Indicates low volatility and market optimism, suggesting stability (Understanding VIX or Volatility Index – TD Bank).
- 15-25: Suggests moderate volatility, with some market fluctuations but not extreme.
- 25-30: Signals increasing market turbulence, with volatility on the rise.
- Above 30: Indicates high volatility, often associated with significant market swings and fear, potentially signaling buying opportunities for contrarian investors.
The VIX’s inverse correlation with the S&P 500 means it generally rises when stocks fall and declines when stocks rise, making it a valuable tool for hedging. Traders can use VIX futures, options, and exchange-traded products (ETFs/ETNs) like VXX or UVXY to speculate on or hedge against volatility changes. Strategies include mean-reversion trades, exploiting the VIX’s tendency to revert to a long-term average, and volatility arbitrage, capitalizing on differences between implied and realized volatility (VIX Index).
Tools for Accessing Data
Finding the Volatility Index is straightforward with various platforms providing real-time and historical data. Key resources include:
- Financial Websites: Platforms like Yahoo Finance and Bloomberg offer current Volatility Index values and charts, accessible to both retail and institutional traders.
- CBOE Official Site: The CBOE website provides detailed information, including current data, historical prices, and term structure charts, essential for in-depth analysis.
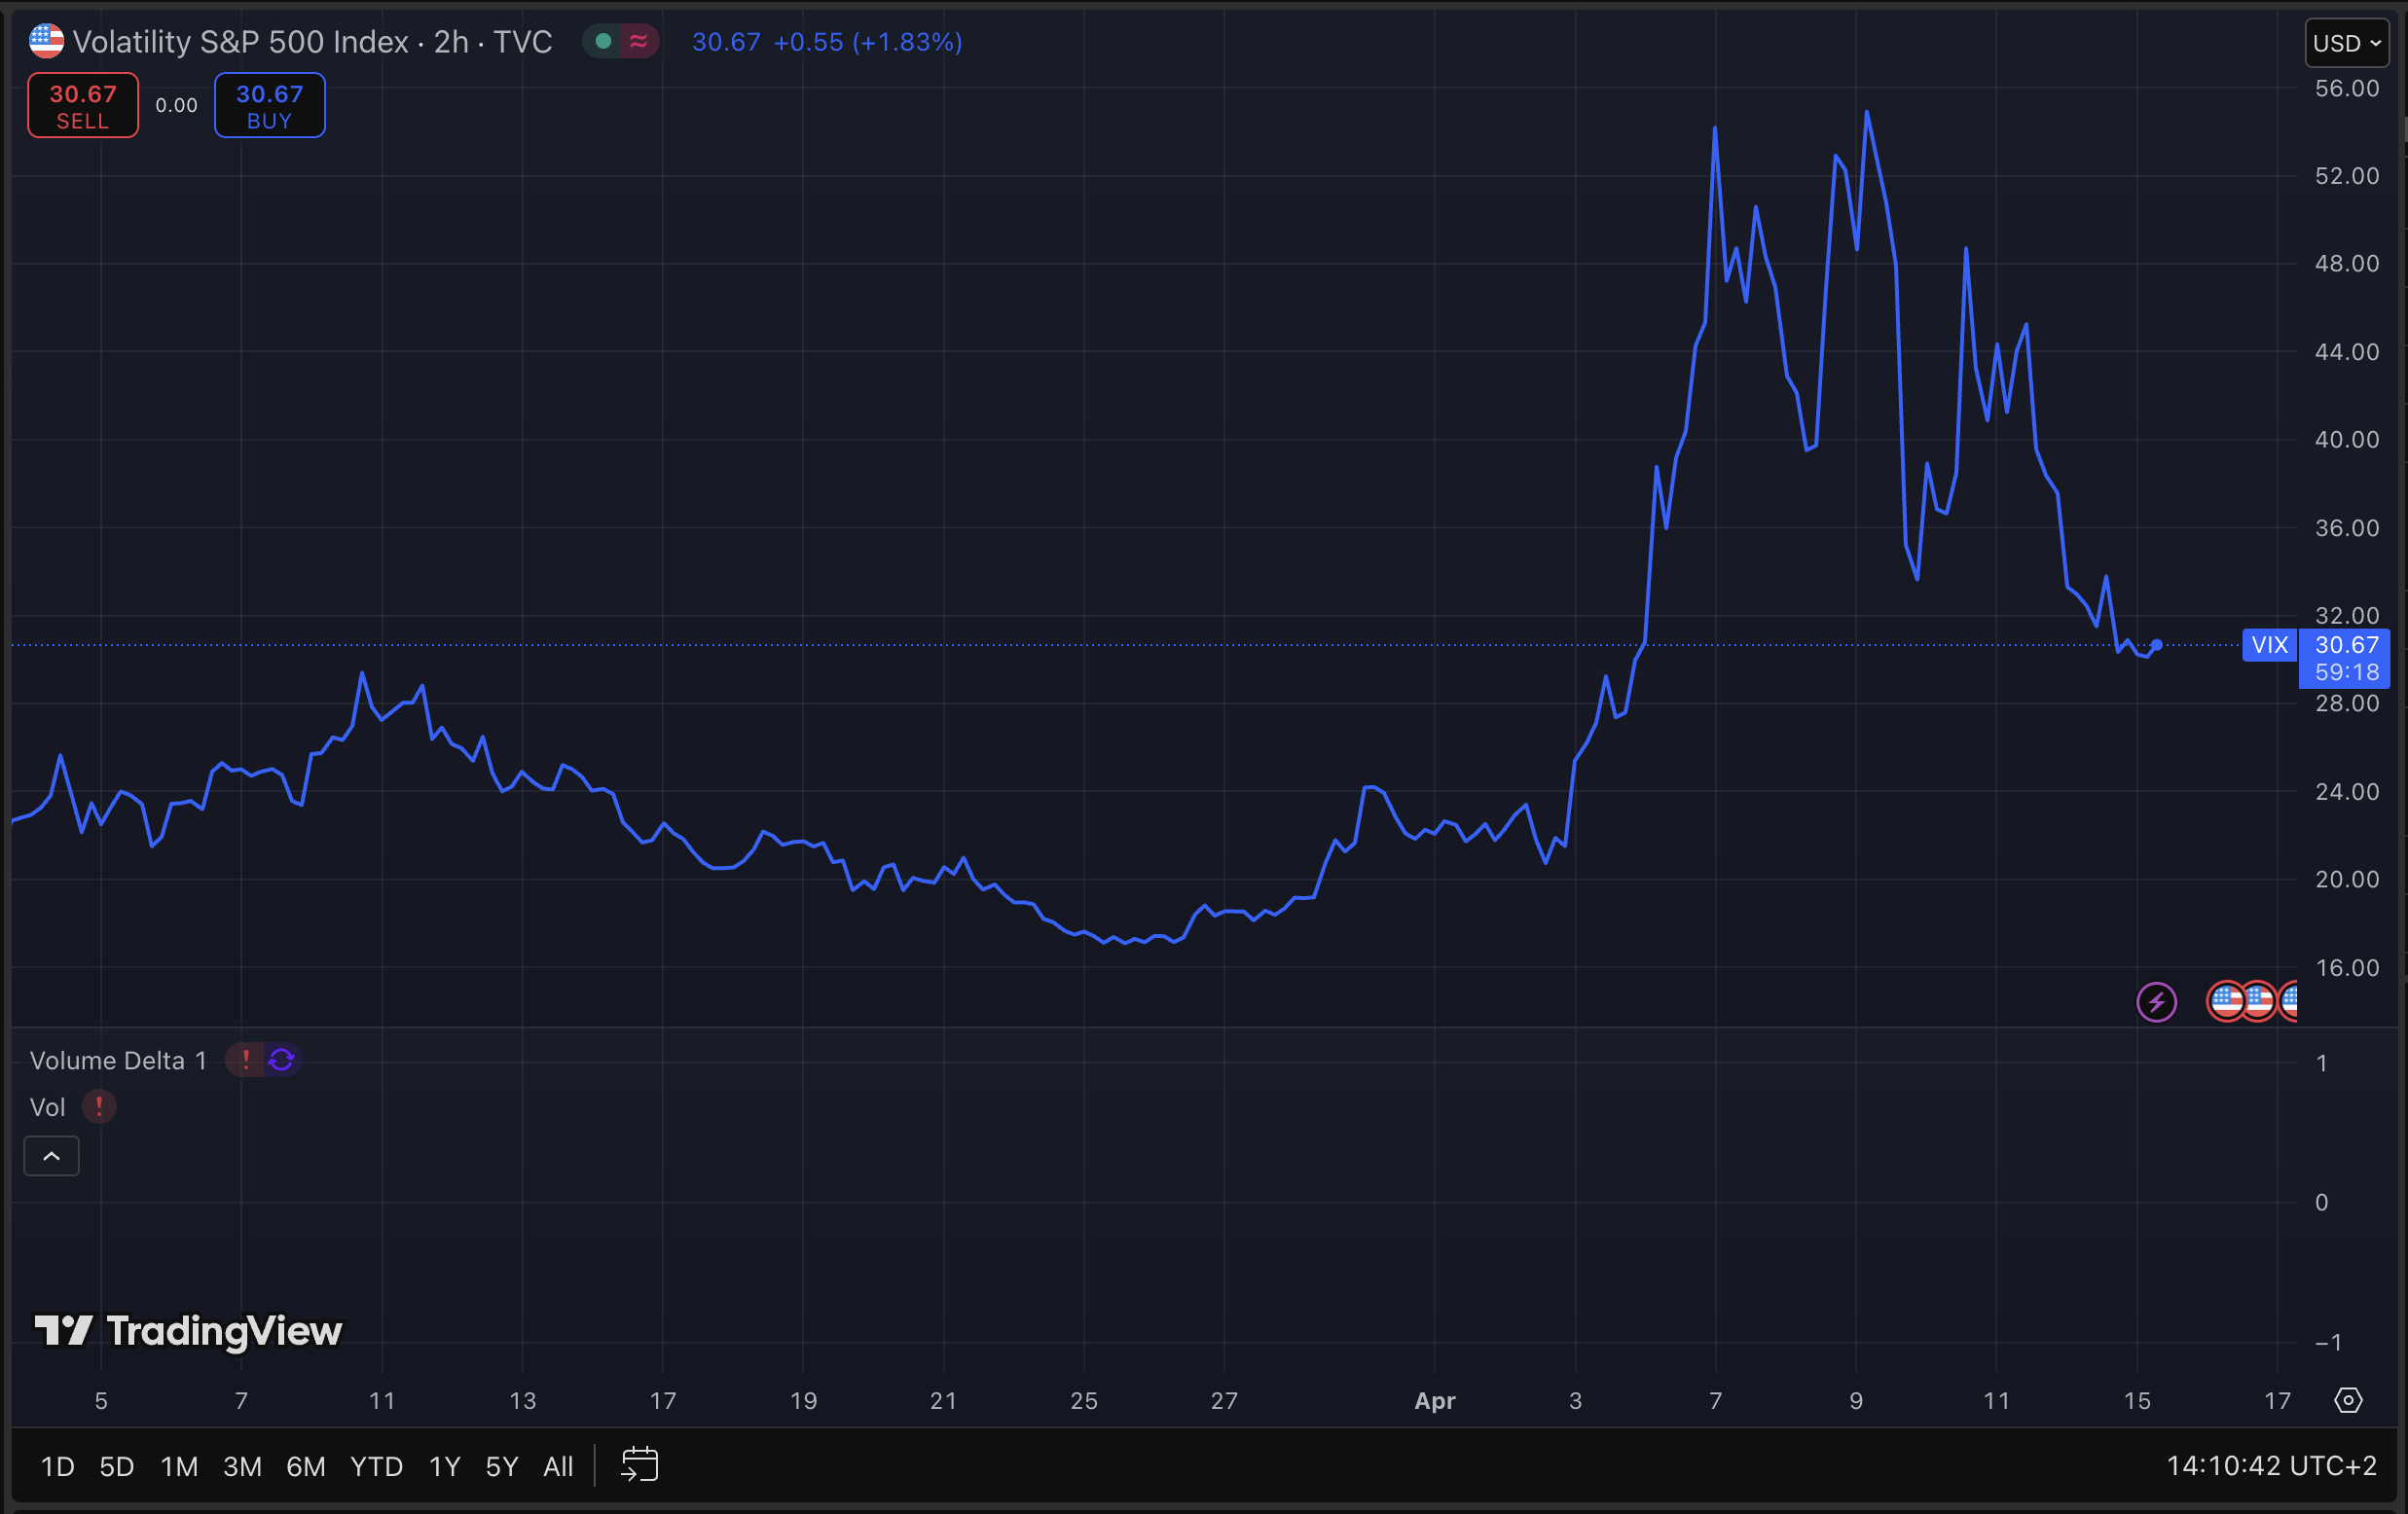
- Trading Platforms: Tools like TradingView offer real-time Volatility Index data, often integrated with technical analysis features for active traders.
Historical Volatility Index data is also compiled on the CBOE site for convenience, furnished without responsibility for accuracy, accepted on the condition that transmission or omissions shall not form the basis for claims (VIX Index Historical Data).
Predicting Breakouts: Methods and Tools
Predicting significant movements or “breakouts” in the Volatility Index involves analyzing potential spikes or drops, often using technical and derivative-based approaches. The evidence leans toward the following methods:
- Technical Analysis: Traders apply indicators like moving averages, Bollinger Bands, and Relative Strength Index (RSI) to the Volatility Index chart on platforms like TradingView. For instance, a moving average crossover might signal a trend change, while Bollinger Bands can identify overbought or oversold conditions. Historical analysis of support and resistance lines complements these tools, enhancing prediction accuracy (Technical Analysis of VIX – TradingView).
- VIX Futures Term Structure Analysis: The shape of the Volatility Index futures term structure, available on the CBOE website, provides insights into market expectations. Contango (futures prices higher than spot) suggests stability or decreasing volatility, while backwardation (futures lower than spot) often occurs during high volatility periods, indicating potential near-term spikes. This analysis helps traders anticipate shifts in market sentiment (VIX Index).
- Options Market Analysis: Since Volatility Index is derived from SPX options, analyzing implied volatility surfaces and options pricing can offer additional clues, though this requires advanced tools like LiveVol analytics platforms (VIX Options).
Given the mean-reverting nature of volatility, traders often look for extremes (e.g., Volatility Index above 30 or below 15) as potential reversal points, though results can vary based on market conditions and external factors like economic events or geopolitical tensions.
Supporting Research and Resources
The analysis draws from official CBOE documentation, financial analysis platforms, and trading strategy articles, ensuring a comprehensive view. Research guides like “A Practitioner’s Guide to Reading VIX” by S&P Dow Jones Indices and “VIX Your Portfolio” by BlackRock, available on the CBOE website, offer further depth for advanced traders (CBOE VIX Index).
VIX Level Interpretations
| VIX Range | Interpretation | Market Implication |
|---|---|---|
| 0-15 | Low volatility, optimism | Stable, complacent market |
| 15-25 | Moderate volatility | Some fluctuations, not extreme |
| 25-30 | Increasing volatility, turbulence | Potential for market stress |
| Above 30 | High volatility, fear | Likely significant swings, fear peak |
This table, derived from Understanding VIX or Volatility Index – TD Bank, aids traders in quick decision-making.
Conclusion
It is a versatile tool for traders, offering insights into market sentiment, risk management, and speculative opportunities. By leveraging financial websites, technical analysis, and futures term structure, traders can enhance their strategies, though predictions require careful consideration of market dynamics. The provided meta description ensures the article is SEO-friendly, catering to both novice and experienced traders.