A Bollinger Band® is a technical analysis instrument consisting of trendlines established at two standard deviations, both above and below, from a security’s price simple moving average (SMA). Users can customize these bands to suit their analysis needs.
Developed by technical analyst John Bollinger, Bollinger Bands are crafted to provide investors with a more likely chance of determining when an asset is in an oversold or overbought state.
How to Calculate Bollinger Bands
To calculate Bollinger Bands, the first step involves determining the simple moving average (SMA) of the security, commonly using a 20-day period. This 20-day SMA is calculated by averaging the closing prices for the first 20 days as the initial data point.
Subsequent data points are generated by excluding the earliest price, incorporating the price on the 21st day, averaging these values, and continuing this process over time. The next critical step is to calculate the standard deviation of the security’s price. Standard deviation is a statistical measure of variance, widely used in fields like statistics, economics, accounting, and finance.
For any given data set, standard deviation quantifies the extent to which numbers deviate from their average value. It is computed by taking the square root of the variance, which is the average of the squared differences from the mean.
Finally, this standard deviation value is multiplied by two. This figure is then added to and subtracted from each point on the SMA line to create the upper and lower bands of the Bollinger Bands.
Here is this Bollinger Band® formula:
Bollinger Bands® Formula:
$$
\text{BOLU} = \text{MA}(TP, n) + m \times \sigma(TP, n)
$$
$$
\text{BOLD} = \text{MA}(TP, n) – m \times \sigma(TP, n)
$$
Where:
– \( \text{BOLU} \) = Upper Bollinger Band
– \( \text{BOLD} \) = Lower Bollinger Band
– \( \text{MA}(TP, n) \) = Moving Average of the Typical Price over \( n \) periods
– \( TP \) (Typical Price) = \( \dfrac{\text{High} + \text{Low} + \text{Close}}{3} \)
– \( n \) = Number of periods in the moving average (typically 20)
– \( m \) = Number of standard deviations (typically 2)
– \( \sigma(TP, n) \) = Standard Deviation of the Typical Price over \( n \) periods
What Do Bollinger Bands Tell You?
Bollinger Bands are a widely used technique in trading. A common belief among traders is that as prices approach the upper band, the market becomes increasingly overbought, and conversely, as prices near the lower band, the market is deemed more oversold. John Bollinger, the creator of this tool, has established a set of 22 rules to be followed when utilizing the bands as part of a trading system. This framework is designed to help traders effectively interpret and respond to the signals provided by the Bollinger Bands.
The Squeeze
The “squeeze” is the central concept of Bollinger Bands. When the bands come close together, constricting the moving average, it is called a squeeze. A squeeze signals a period of low volatility and is considered by traders to be a potential sign of future increased volatility and possible trading opportunities.
Conversely, the wider apart the bands move, the more likely the chance of a decrease in volatility and the greater the possibility of exiting a trade. These conditions are not trading signals. The bands do not indicate when the change may take place or in which direction the price could move.
Breakouts
Approximately 90% of price action occurs between the two bands. Any breakout above or below the bands is significant. The breakout is not a trading signal and many investors mistake that when the price hits or exceeds one of the bands as a signal to buy or sell. Breakouts provide no clue as to the direction and extent of future price movement.
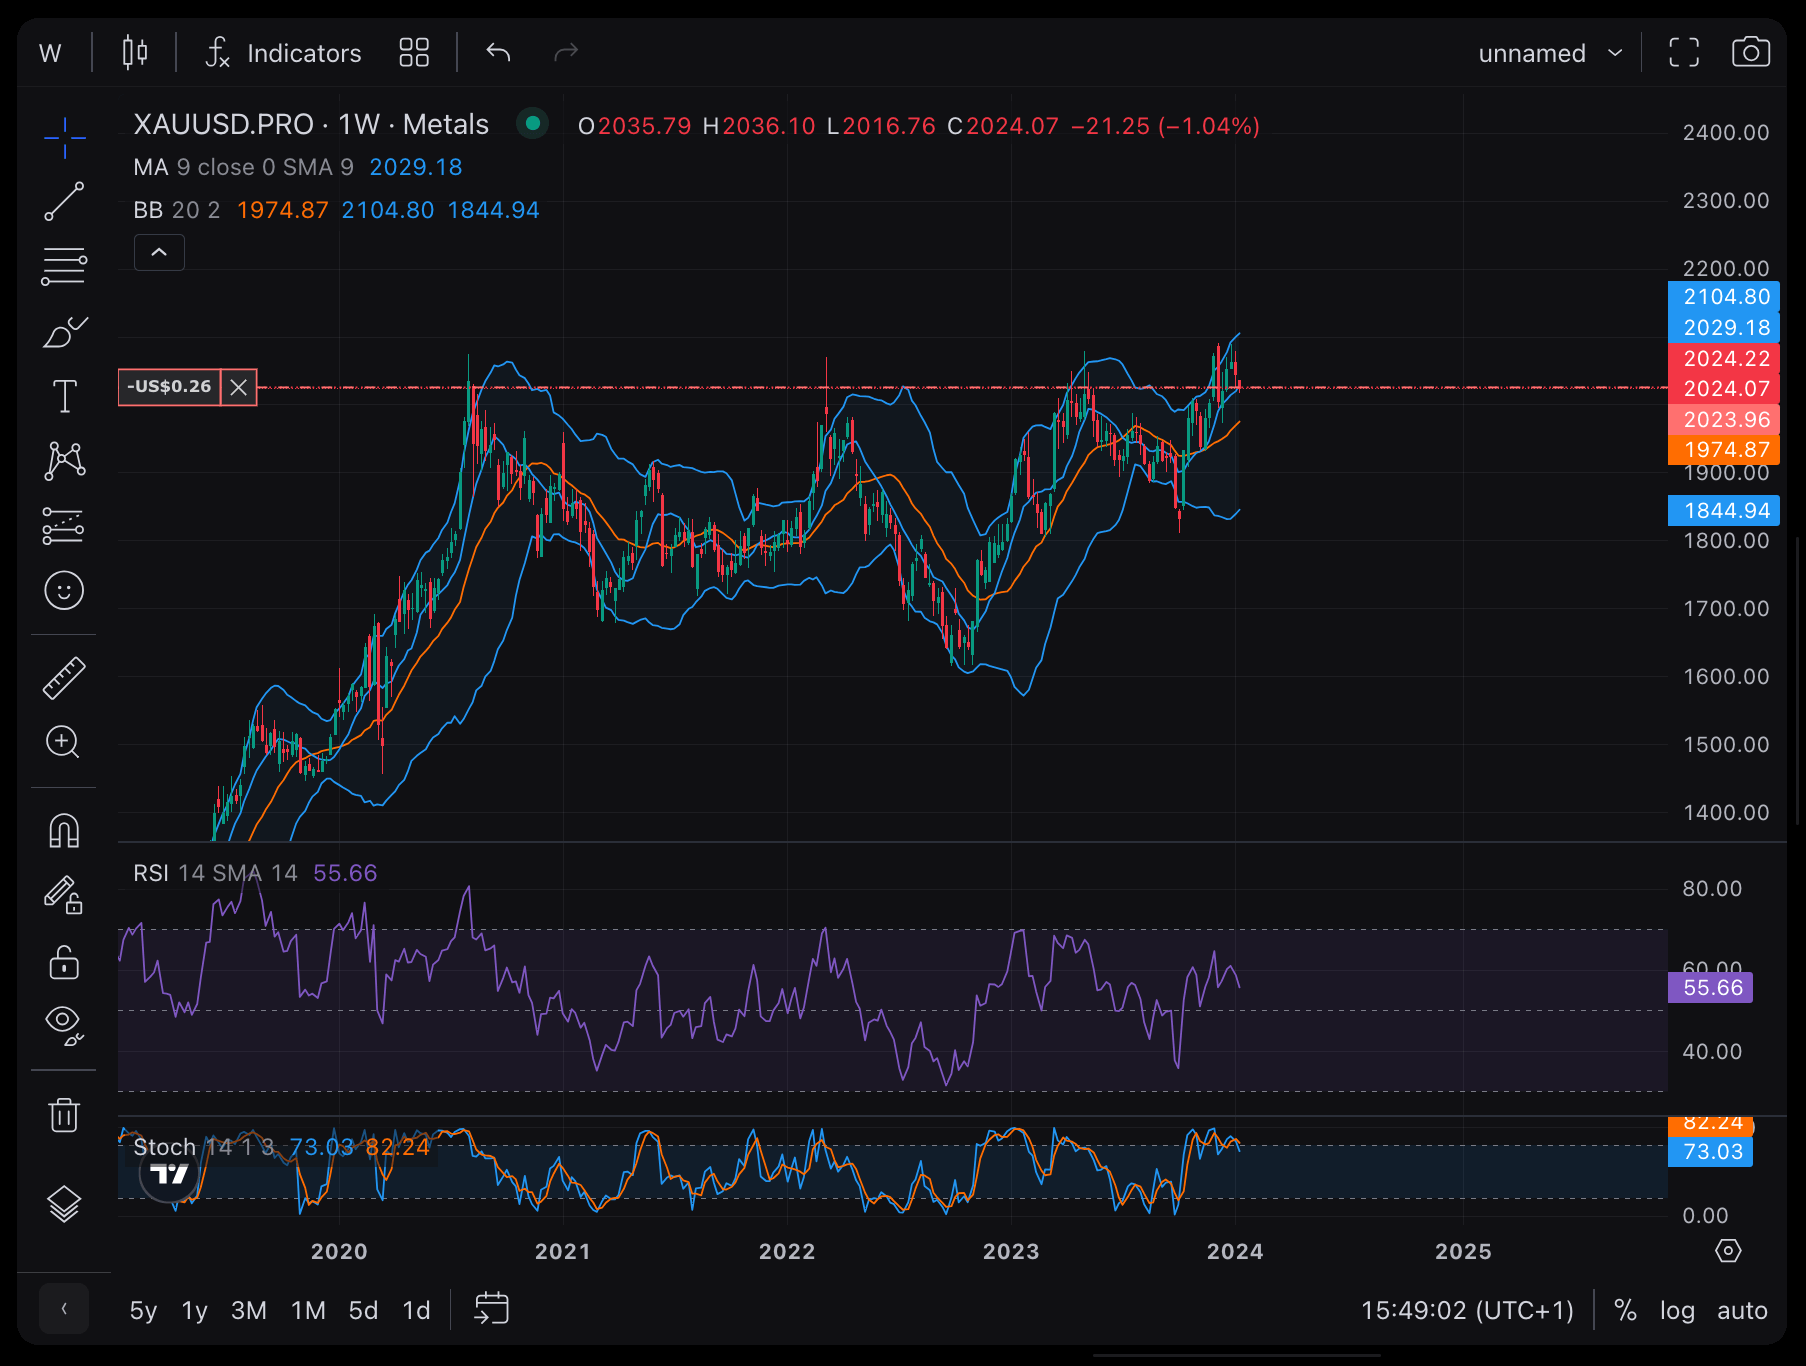
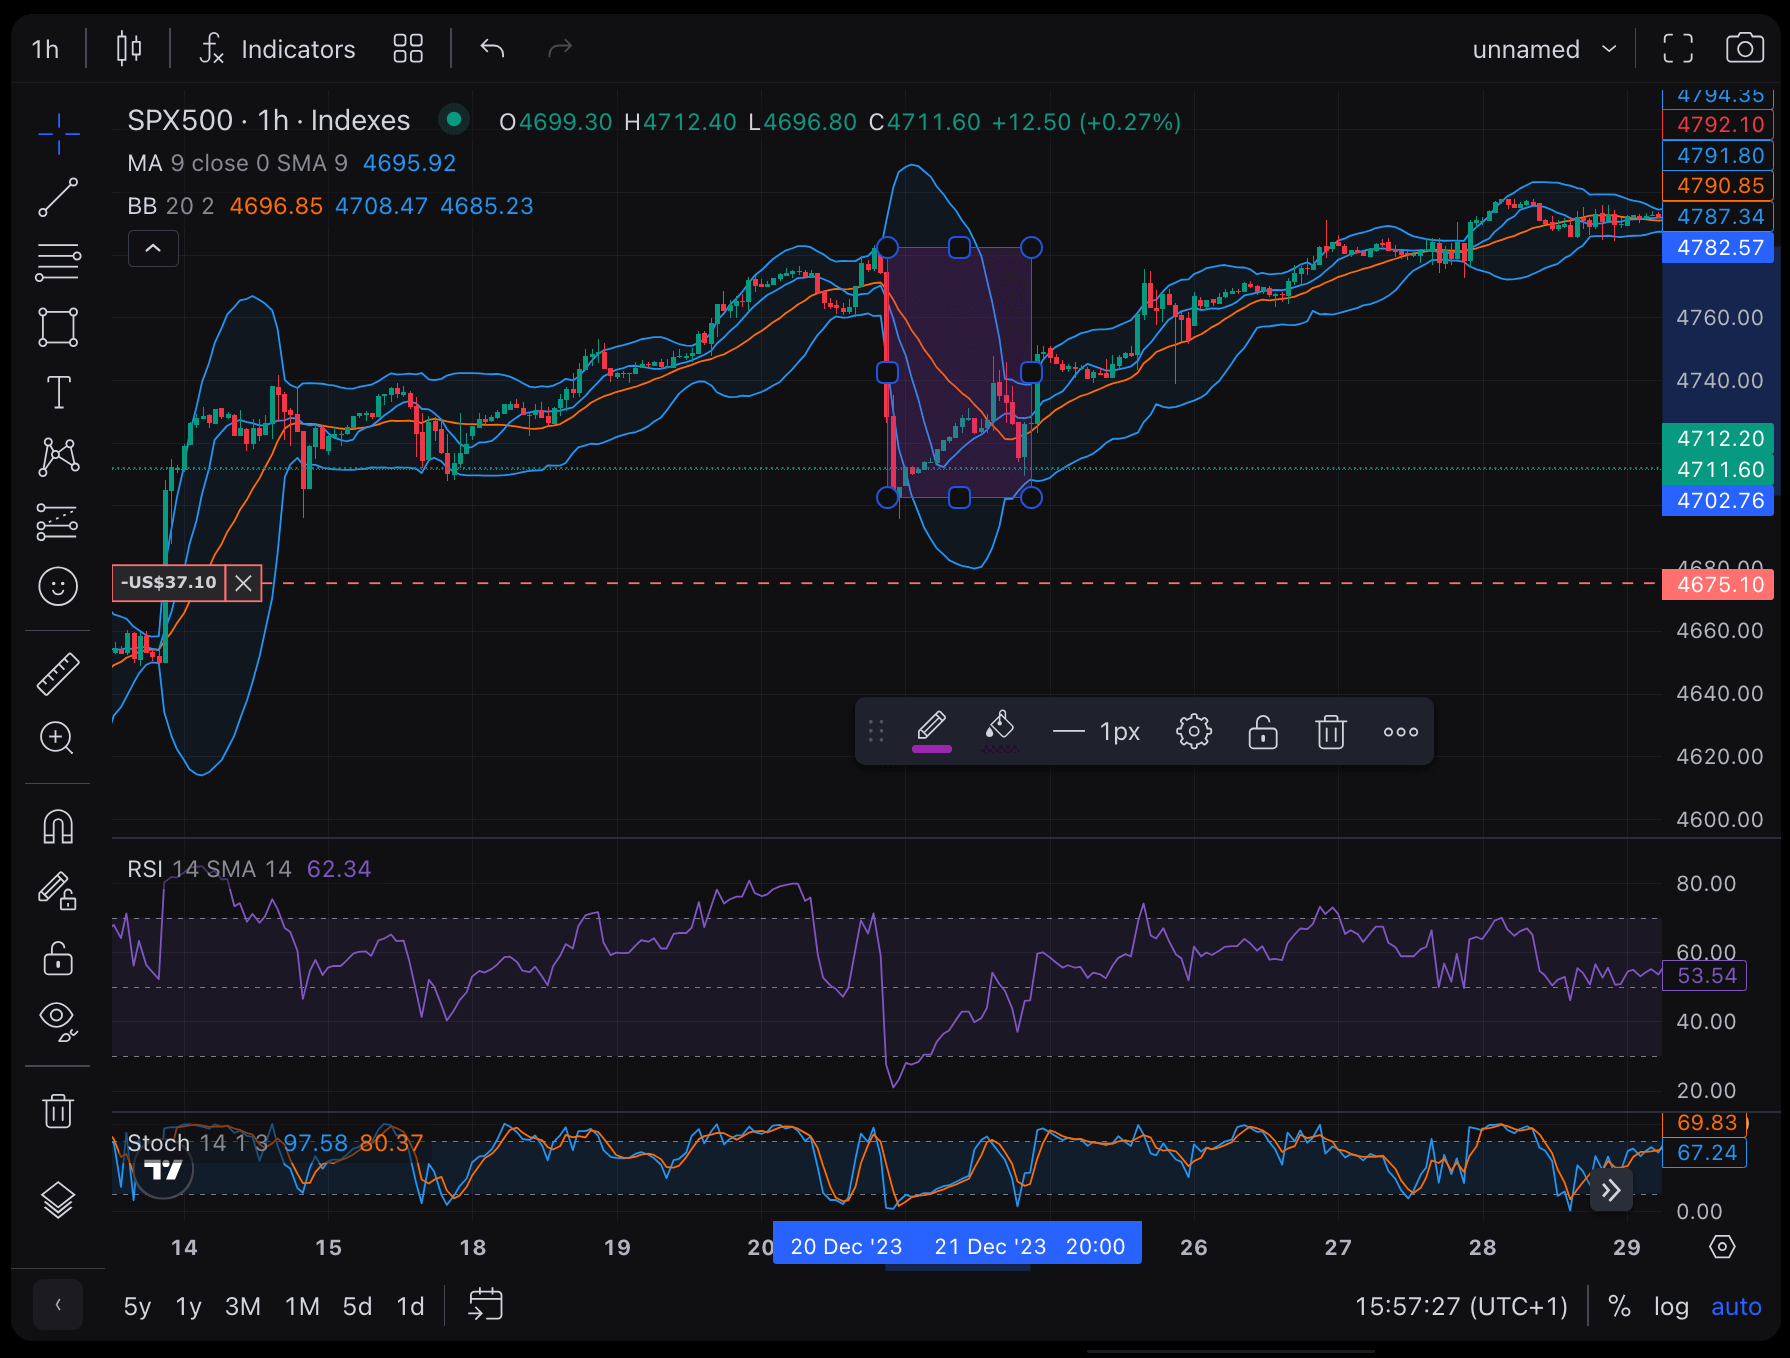
Example of Bollinger Bands®
In the chart below, Bollinger Bands® bracket the 20-day SMA of the stock with an upper and lower band along with the daily movements of the stock’s price. Because standard deviation is a measure of volatility, when the markets become more volatile the bands widen; during less volatile periods, the bands’ contract.
Limitations of Bollinger Bands®
Bollinger Bands® is not a standalone trading system but just one indicator designed to provide traders with information regarding price volatility. John Bollinger suggests using them with two or three other non-correlated indicators that provide more direct market signals and indicators based on different types of data. Some of his favored technical techniques are moving average divergence/convergence (MACD), on-balance volume, and relative strength index (RSI).
Because Bollinger Bands® are computed from a simple moving average, they weigh older price data the same as the most recent, meaning that new information may be diluted by outdated data. Also, the use of 20-day SMA and 2 standard deviations is a bit arbitrary and may not work for everyone in every situation. Traders should adjust their SMA and standard deviation assumptions accordingly and monitor them.
The Bottom Line
Bollinger Bands® can be a useful tool for traders for assessing the relative level of over- or under-sold position of a stock and provides them with insight on when to enter and exit a position. Certain aspects of Bollinger Bands®, such as the squeeze, work well for currency trading. Buying when stock prices cross below the lower Bollinger Band® often helps traders take advantage of oversold conditions and profit when the stock price moves back up toward the center moving-average line.