What Is a Moving Average (MA)?
In finance, a moving average (MA) is a stock indicator commonly used in technical analysis. The purpose of calculating the average of a stock is to smooth out the price data by creating a constantly updated average price. By calculating it, we can mitigate the impact of random, short-term fluctuations on the stock price over a specified time period.
Understanding a Moving Average (MA)
They are calculated to identify the trend direction of a stock or to determine its support and resistance levels. It is a trend-following or lagging indicator because it is based on past prices. The longer the period for the MA, the greater the lag. For example, a 200-day MA will have a much greater degree of lag than a 20-day MA because it contains prices for the past 200 days. The figures for the 50-day and 200-day MA are widely followed by investors and traders and are considered important trading signals. Investors can choose different periods of varying lengths to calculate MA based on their trading objectives. Shorter moving averages are typically used for short-term trading, while longer-term MA are more suited for long-term investors.
Types of Moving Averages
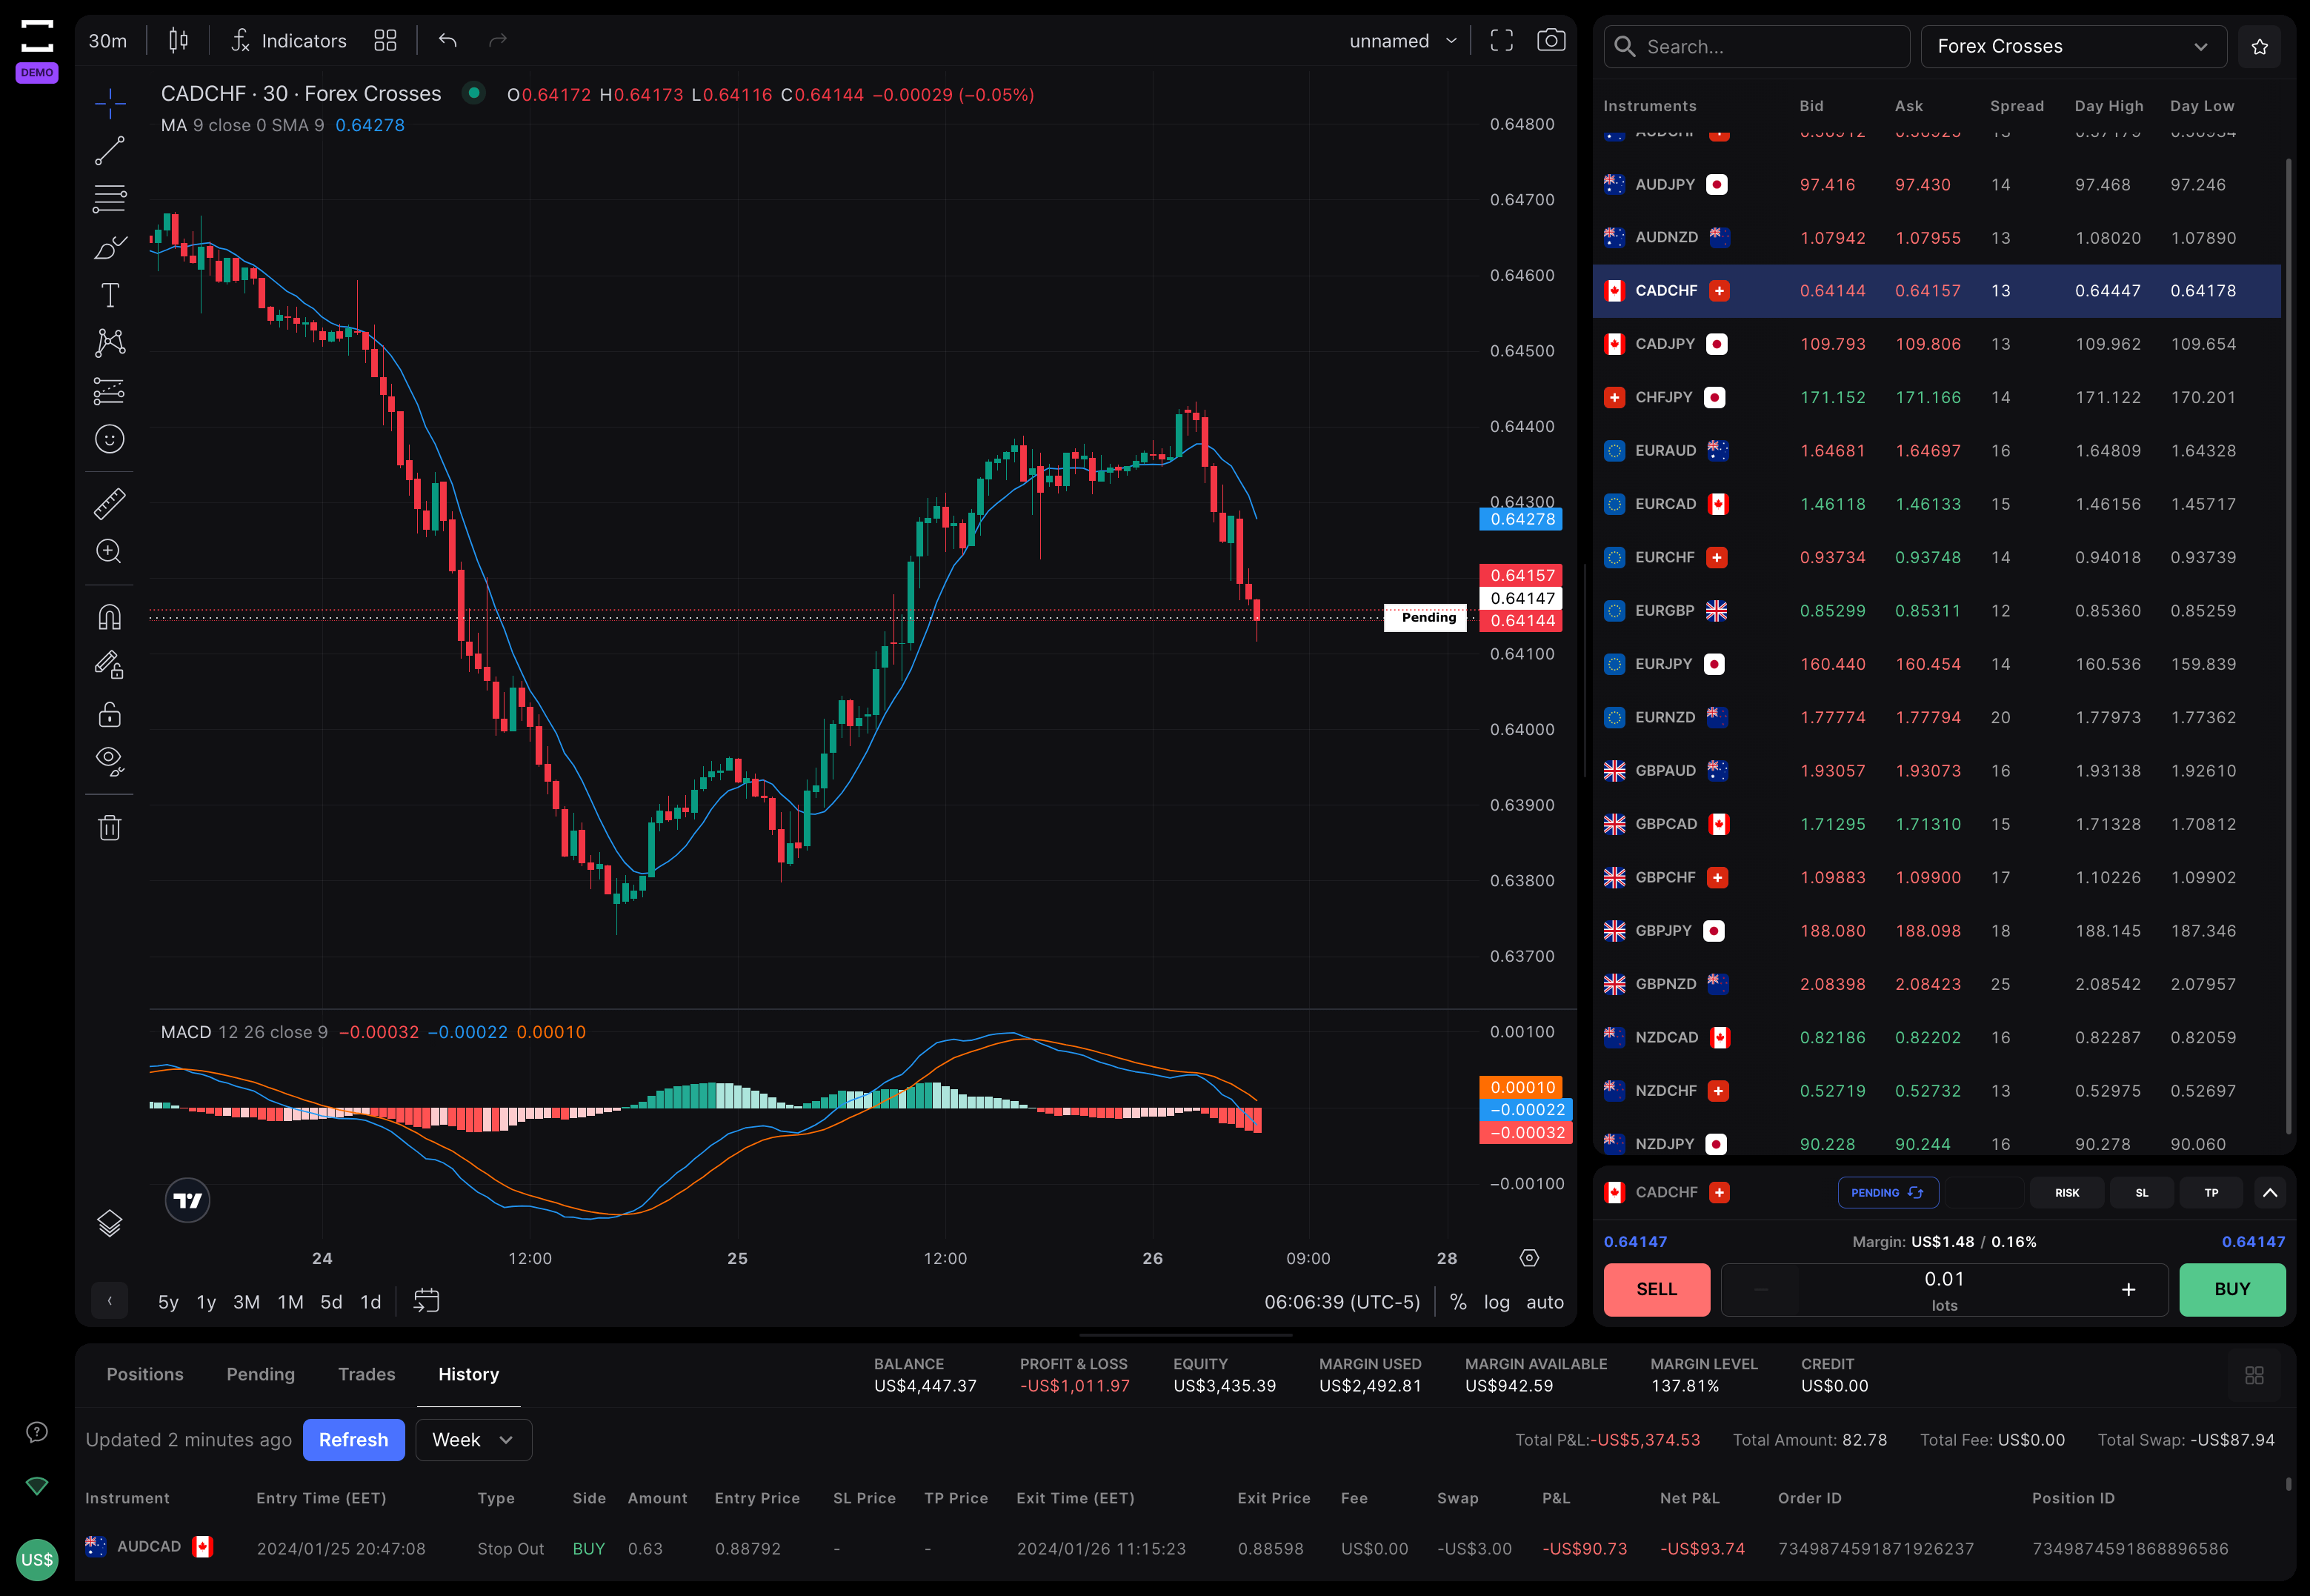
Simple Moving Average (SMA)
A simple moving average (SMA) is calculated by taking the arithmetic mean of a given set of values over a specified period. The formula for calculating the SMA of a security is:
SMA = (A1 + A2 + … + An) / n
Where:
A = Average in period n
n = Number of time periods
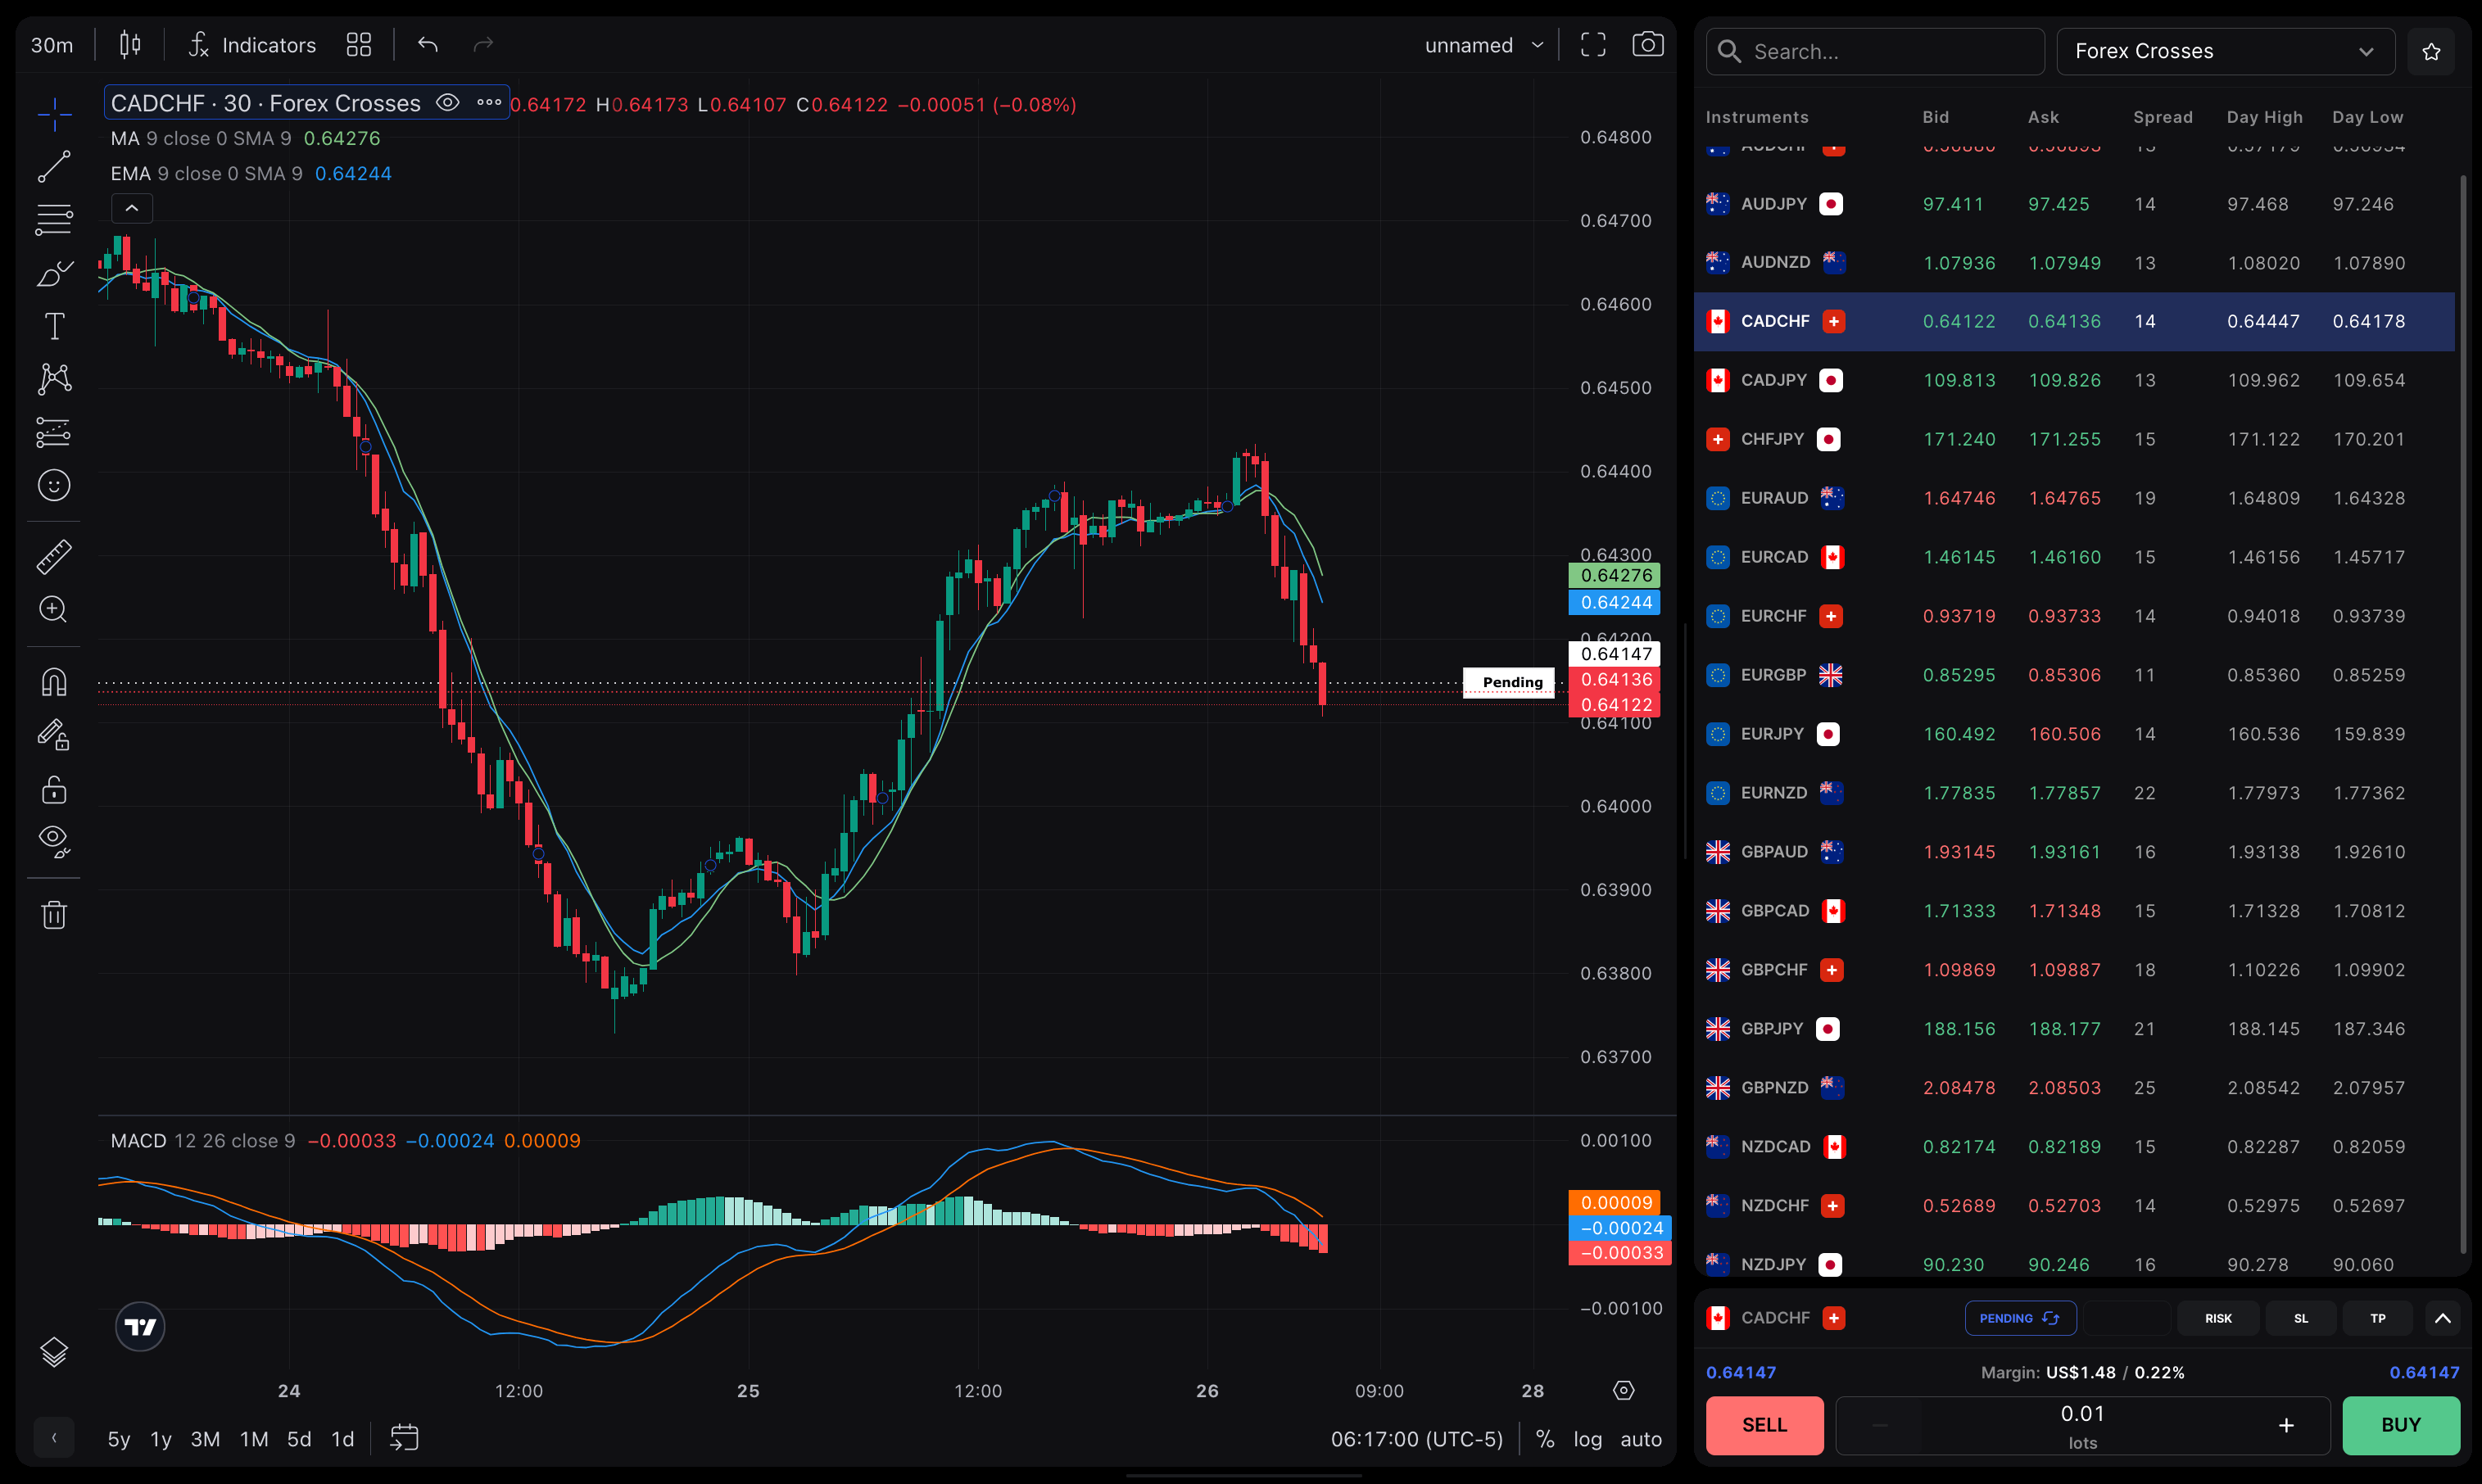
Exponential Moving Average (EMA)
The exponential moving average (EMA) gives more weight to recent prices in an attempt to make them more responsive to new information. To calculate an EMA, the simple moving average (SMA) over a particular period is calculated first. Then, the smoothing factor, also known as the “smoothing factor,” is determined using the formula: [2/(selected time period + 1)]. This smoothing factor is combined with the previous EMA to arrive at the current value. The EMA assigns a higher weighting to recent prices, while the SMA assigns an equal weighting to all values. The formula for calculating the EMA is:
EMA(t) = [V(t) × (s / (1 + d))] + EMA(y) × [1 – (s / (1 + d))]
Where:
EMA(t) = EMA today
V(t) = Value today
EMA(y) = EMA yesterday
s = Smoothing
d = Number of days
Simple Moving Average (SMA) vs. Exponential Moving Average (EMA)
The EMA calculation puts more emphasis on recent data points, making it a weighted average calculation. The EMA responds more quickly to changing prices compared to the SMA. The EMA has a higher value when the price is rising and falls faster than the SMA when the price is declining. This responsiveness to price changes is why some traders prefer to use the EMA over the SMA.
Example of a Moving Average
Let’s look at an example of calculating a simple moving average (SMA) for a security using closing prices over 15 days:
Week 1 (5 days): 20, 22, 24, 25, 23
Week 2 (5 days): 26, 28, 26, 29, 27
Week 3 (5 days): 28, 30, 27, 29, 28
A 10-day moving average would average out the closing prices for the first 10 days as the first data point. The next data point would drop the earliest price, add the price on day 11, and take the average.
Example of a Moving Average Indicator
A Bollinger Band® technical indicator has bands generally placed two standard deviations away from a SMA. A move toward the upper band suggests the asset is becoming overbought, while a move close to the lower band suggests the asset is becoming oversold. Since standard deviation is used as a statistical measure of volatility, this indicator adjusts itself to market conditions.
The Bottom Line
A moving average (MA) is a stock indicator commonly used in technical analysis to help smooth out price data by creating a constantly updated average price. A rising MA indicates that the security is in an uptrend, while a declining moving average indicates a downtrend. The exponential moving average (EMA) is generally preferred to a simple moving average (SMA) as it gives more weight to recent prices and shows a clearer response to new information and trends.