What Is a Breakout?
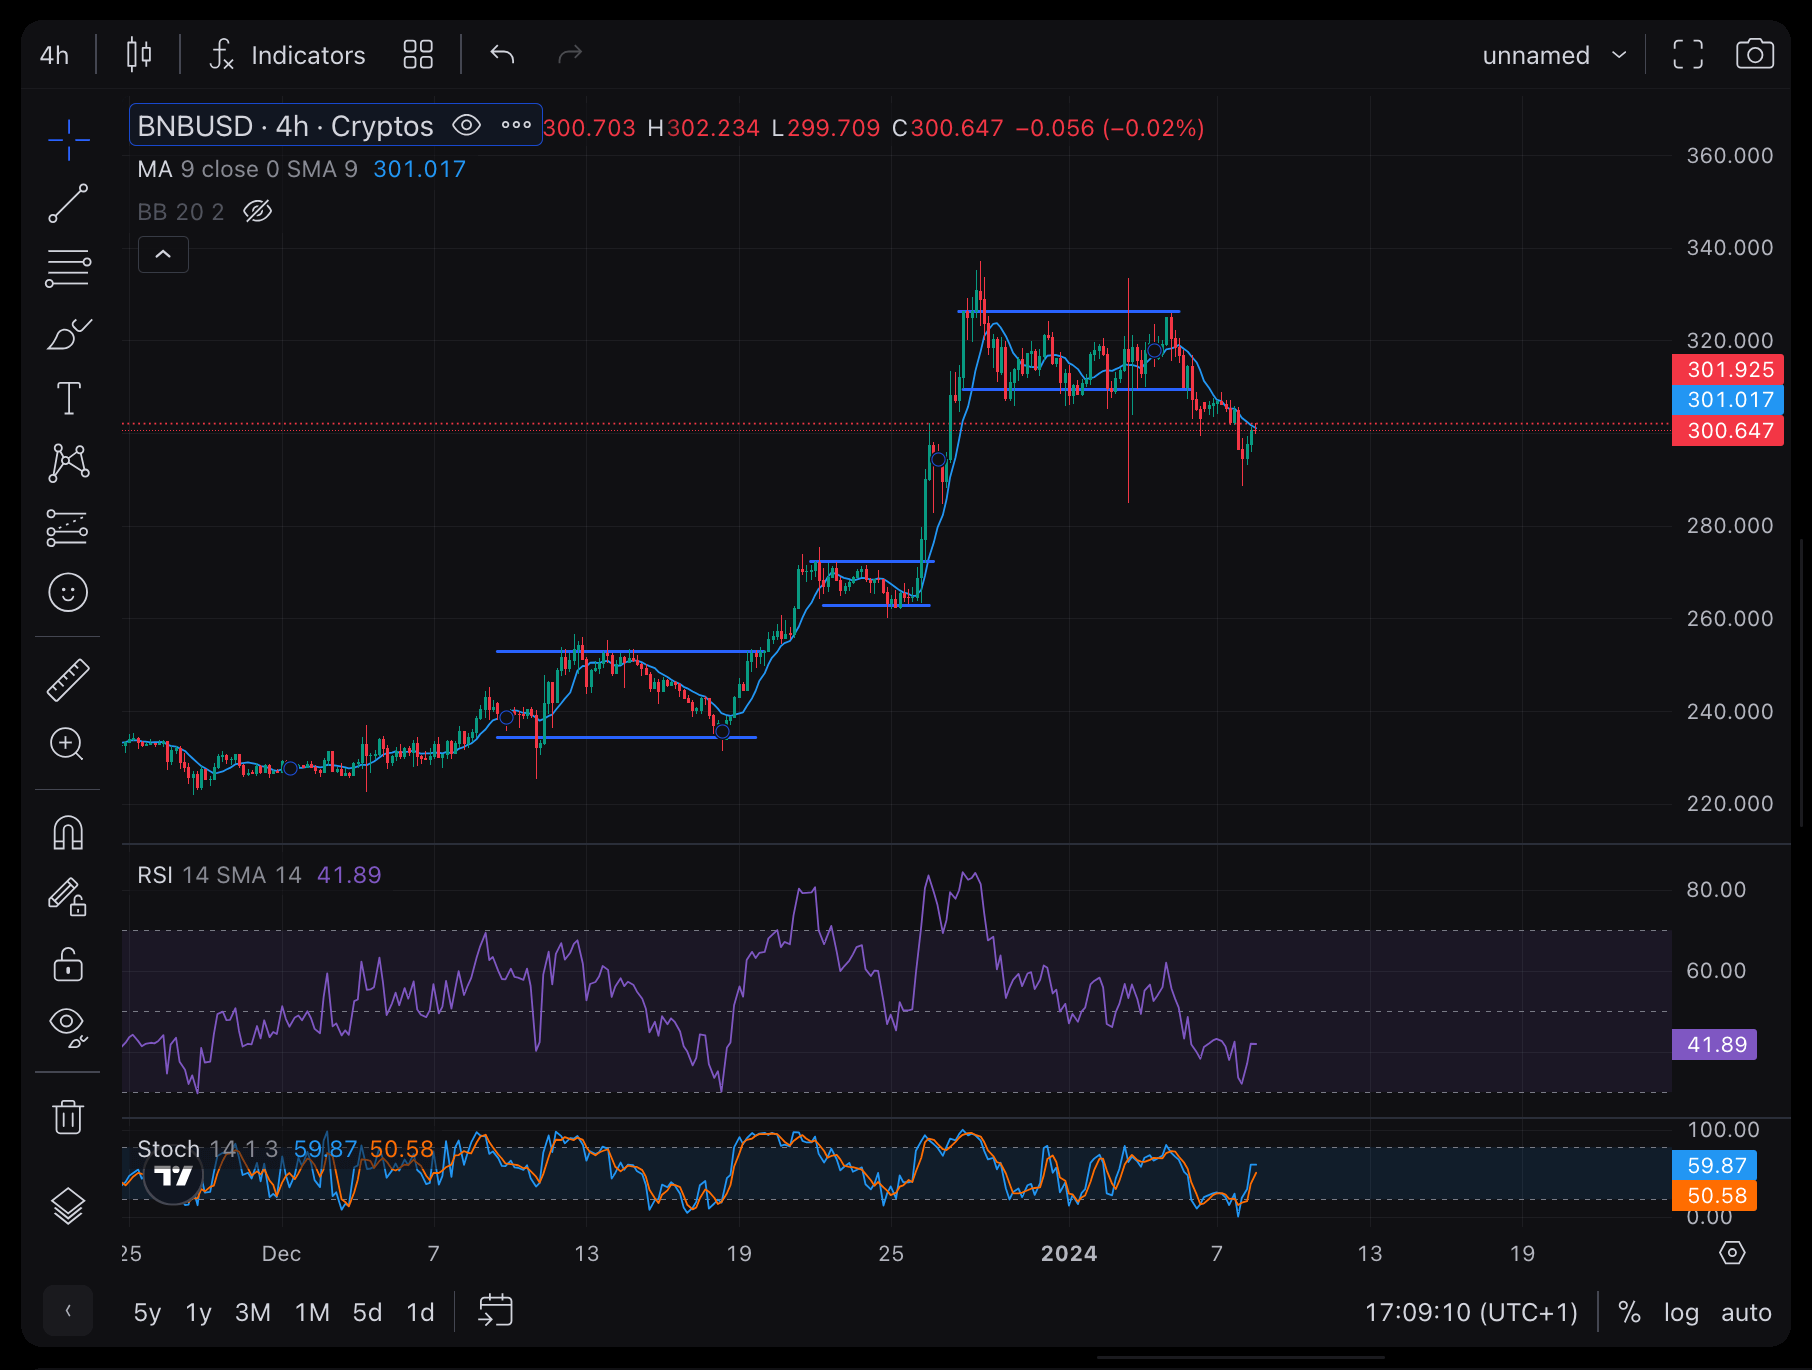
A breakout occurs when the price of an asset, such as a stock, commodity or crypto, exceeds specific thresholds, typically identified as resistance or support levels. This phenomenon often signals a potential shift in the market trend. For example, a price escalation beyond a recognized resistance level in a chart pattern might suggest the commencement of an uptrend. The presence of high trading volume during these movements indicates strong market conviction and support for the new trend.
In essence, a breakout signifies the asset’s price moving beyond the established range of highs or lows, where it typically reverses direction, potentially marking the beginning of a new trend. When such a breakout, especially upwards through a resistance level, is accompanied by substantial trading activity, it reinforces the belief in the strength and sustainability of this emerging trend.
What are Breakouts Signal
Breakouts typically occur after prices have oscillated within defined high and low boundaries. These boundaries are instrumental for traders in determining optimal buying or selling moments. When the price surpasses these predefined levels, it prompts traders into action: some initiate buying while others sell to mitigate further losses.
A breakout accompanied by a high volume of trades is generally regarded as a strong indicator that the new trend will persist. Conversely, if the breakout is characterized by low trading volume, there’s a risk that the trend may not be sustainable. It’s also possible for prices to retreat back into the previous range even after a high-volume breakout, before solidly moving in the new direction.
Chart patterns such as triangles or flags are often precursors to breakouts. Traders monitor these formations closely to gauge the likely direction of the market and adjust their strategies accordingly.

Examples of Breakouts
Consider a scenario where a stock’s price surges during a significant news announcement, breaking through its customary high point. If this upward movement sustains without retracting, it signals to traders that the trend is robust and potentially enduring.
Investors might jump in based on this, setting up a stop loss order just in case things don’t go as planned. As the stock price continues to evolve, these investors might adjust their stop loss orders accordingly to align with the changing market dynamics, thus managing their risk while capitalizing on the momentum.
Breakouts vs. 52-Week Highs/Lows
A breakout has the potential to establish a new 52-week high, especially if it occurs near the previous peak. However, it’s important to note that a 52-week high simply represents the highest price of a stock over the past year and does not inherently signify a breakout. A breakout is a distinct market movement where prices move beyond established resistance or support levels, while a 52-week high is a historical benchmark, regardless of the market dynamics that led to its achievement.

The Limitations of a Breakout
Indeed, this approach is not infallible. There are instances where prices may momentarily breach key levels, only to retract shortly thereafter. Additionally, identifying these pivotal levels is more of an art than a precise science, as it involves subjective judgment and interpretation of market patterns.
Monitoring trading volume is a crucial strategy in this context. High trading volume accompanying a breakout is often a strong indicator of its legitimacy and sustainability. Conversely, a breakout with low trading volume might suggest a lack of conviction in the market, raising doubts about its persistence. Therefore, trading volume serves as a valuable metric for assessing the strength and reliability of a breakout.