Understanding Trends
Trend trading is a trading strategy focused on capitalizing on the momentum of an asset as it moves consistently in a particular direction, whether that direction is upward, downward, or sideways.
Conceptually, trend trading can be compared to choosing the path of least resistance. If the market is on an upward trajectory, traders take long positions, and if it’s in a downward trend, they opt for short positions.
It’s helpful to break down trends into primary and secondary movements. A primary trend refers to the overarching, long-term movement of the asset. However, there are also secondary trends, which represent shorter-term fluctuations within the primary trend.
So, while some trend traders adopt a broader perspective, others engage in swing trading within a trending market. Swing traders aim to profit from the smaller peaks and troughs along the way.
It’s worth noting that while trend trading and trend following are often used interchangeably, trend following is a slightly different approach. In trend following, the trader seeks to ride the entire primary trend from its inception to its conclusion, without actively targeting opportunities within smaller oscillations.
How do you identify a trend?
Identifying trends often involves the use of trendlines, which are simply lines drawn on a price chart. There are three primary types of trends:
- Uptrends
- Downtrends
- Sideways trends
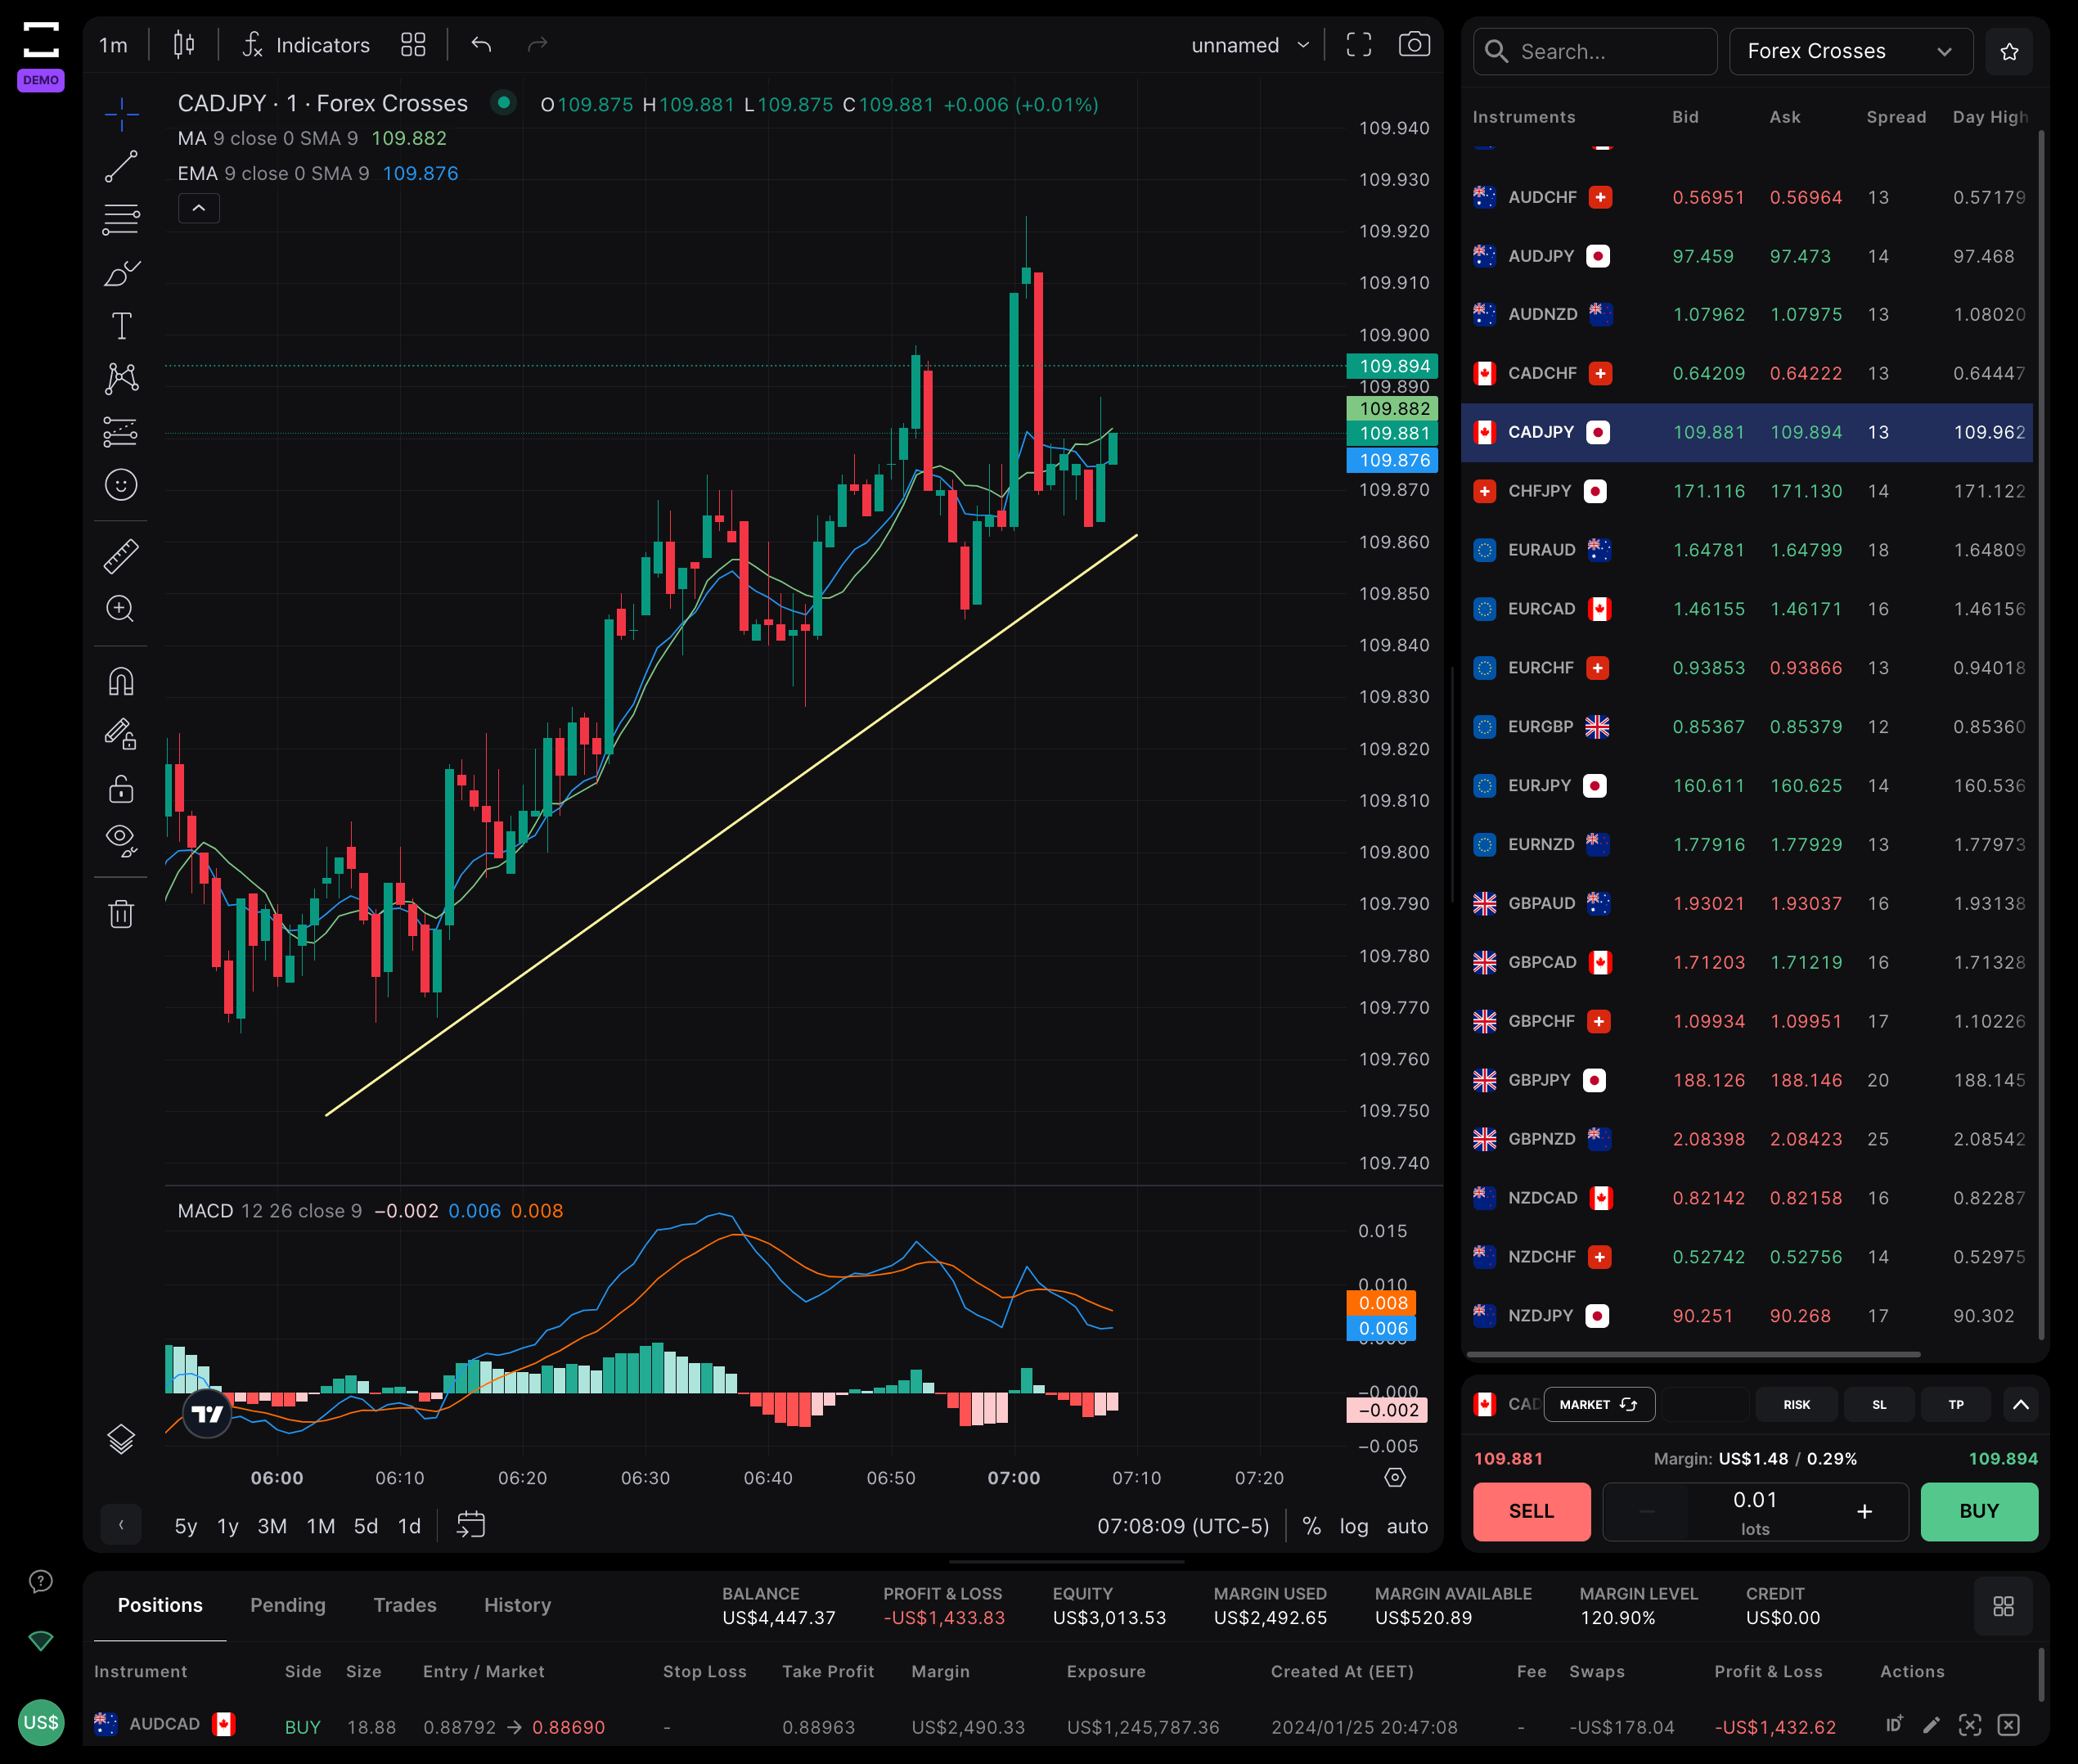
To identify an uptrend, you connect two low points on a chart. If the resulting line slopes upward, it signifies an “uptrend,” characterized by higher highs and lower lows. In this scenario, traders typically consider taking long positions to capitalize on the bullish sentiment in the market.
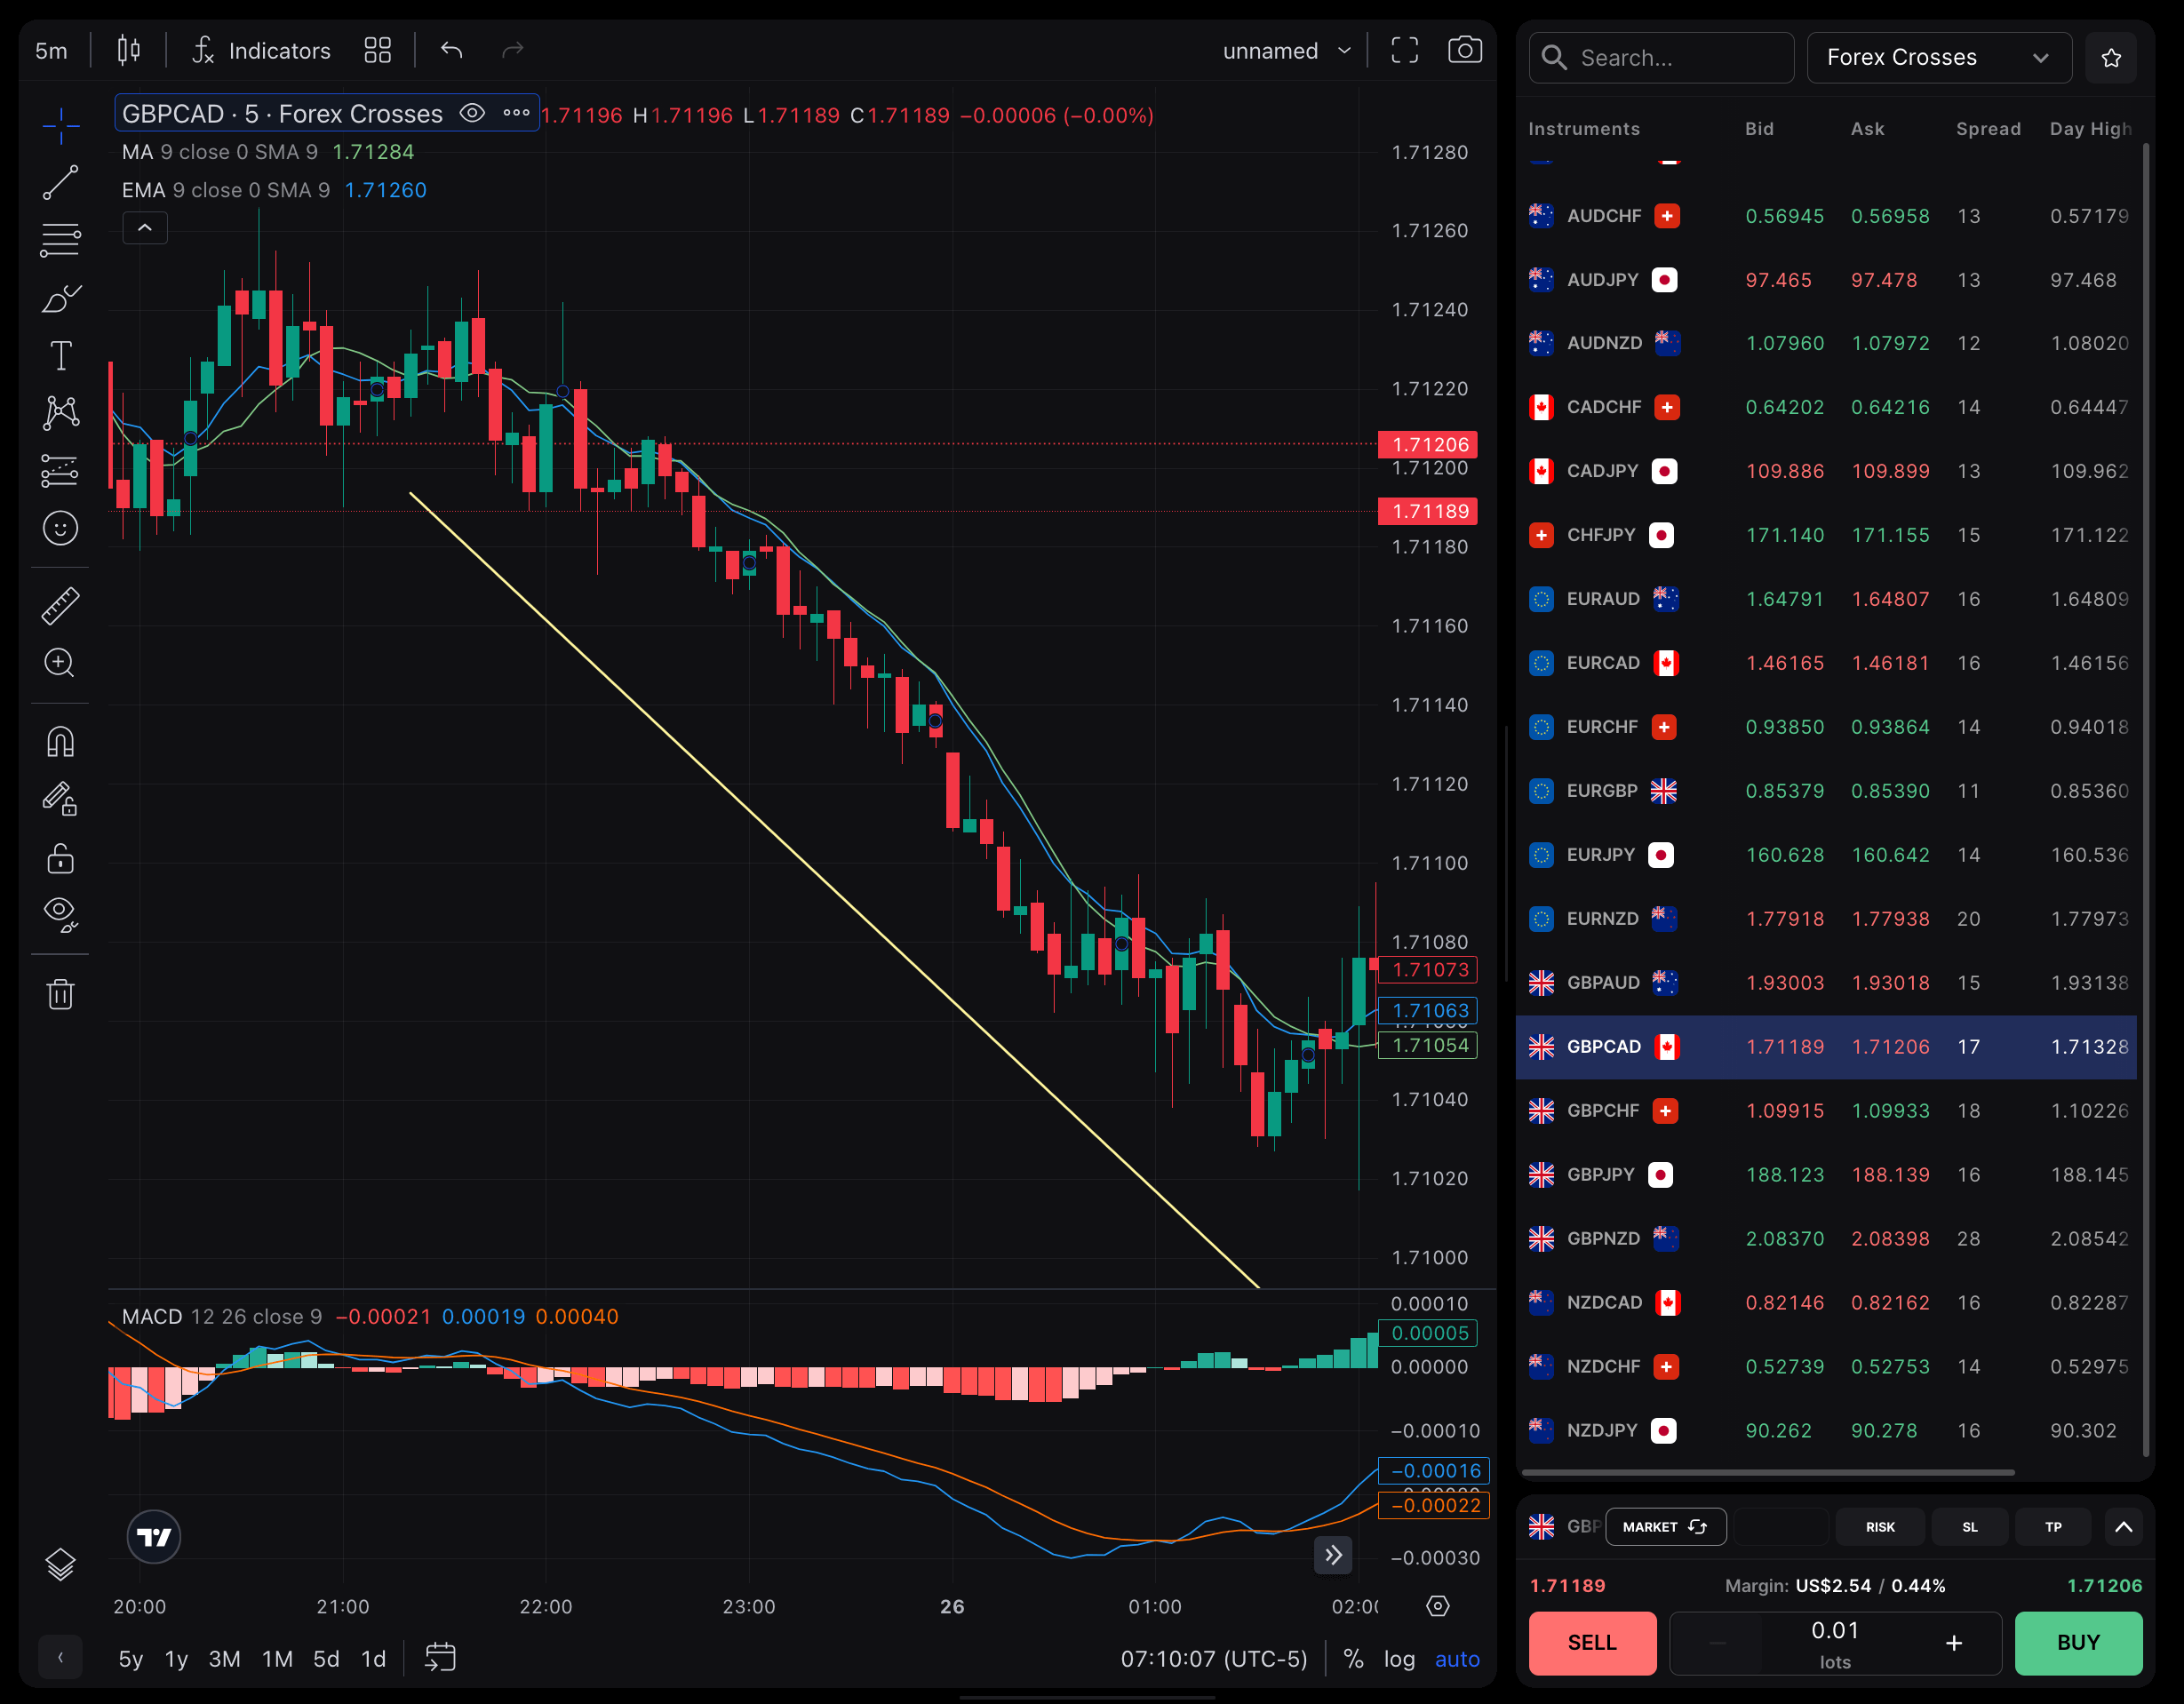
To identify a downtrend, you would connect two high points on a price chart. If the line slopes downward, it indicates a “downtrend,” characterized by lower highs and lower lows. In such cases, traders often contemplate short selling as a strategy to profit from the bearish sentiment in the market.
Sometimes, when you connect both highs and lows on a price chart, you may discover horizontal lines. This pattern is referred to as a “sideways trend” or a “range-bound market.” In a sideways trend, the price tends to move within a defined range between these two lines. Traders in such situations have the flexibility to consider both long and short positions, aiming to profit from the smaller price oscillations occurring within this range.
How do you know when a trend is over?
The most obvious way of knowing when a trend is over is if there’s a reversal. This is when the asset’s price starts to move in the opposite direction for a sustained period. It usually occurs at a point of support or resistance.
It’s important to ensure a reversal is taking place, not just a more temporary retracement, otherwise, you could end up exiting a trade too early. You should use indicators to assess whether a market is retracing or reversing, such as the Fibonacci retracements tool.
You should always attach an exit order to your position – such as a take profit or stop loss – that would automatically close your position once a set level of profit or loss has been met. Risk management is just as important as a trading strategy when it comes to opening and closing positions.
Trend trading strategies
Trend trading strategies are designed to establish a clear plan for when and how to trade. These strategies involve identifying emerging trends as early as possible, confirming their validity, and exiting the market before the trend reverses.
Most trading strategies are built upon either technical analysis, which includes the use of indicators and price action, or fundamental analysis. Some strategies combine elements of both approaches.
While trend trading is a strategy in itself, it often incorporates aspects of other methodologies depending on the nature of the prevailing trend and the type of analysis being employed. Here are four popular trend trading strategies:
1. Breakout Trading
Breakout trading is commonly applied in highly directional markets where prices consistently make higher highs or lower lows. The strategy involves identifying well-established support and resistance levels, where the market has previously reversed during a trend. Traders assess the momentum accompanying the price as these levels are approached. If there is strong momentum, it suggests that the market is likely to “break out” of its current range, initiating a new trend.
2. Retracement Trading
Retracement trading is more suitable for trends that exhibit periods of both strength and weakness, often characterized by temporary counter-trends. Traders look for these temporary reversals as potential entry points, allowing them to enter positions at more favorable prices while still benefiting from the overall trend. However, traders employing this strategy must remain vigilant to ensure that a full trend reversal is not underway and use stop-loss orders to manage risk.
3. Range Trading
Range trading is effective in situations where trends are weak, such as sideways markets that trade within defined support and resistance levels. To take a long position, traders enter the market near established support levels and exit near known resistance levels. Conversely, for short positions, traders open near resistance levels and close near support levels.
4. News Trading
News trading focuses on fundamental factors such as company earnings, macroeconomic data, and breaking news events that influence how the public perceives an asset. For instance, traders may anticipate that a company’s stock price will continue to rise if it has been consistently profitable for four consecutive quarters. They might take a long position before the release of the fourth-quarter earnings report, holding it until the earnings turn negative, which could take months or even years. News trading relies heavily on fundamental analysis and is suitable for individuals who prefer not to delve into technical analysis, although combining it with other tools can enhance decision-making.
Best indicators for trend trading
Popular trend indicators include moving averages, momentum indicators like the RSI (Relative Strength Index), and Bollinger Bands. Let’s examine each of these indicators:
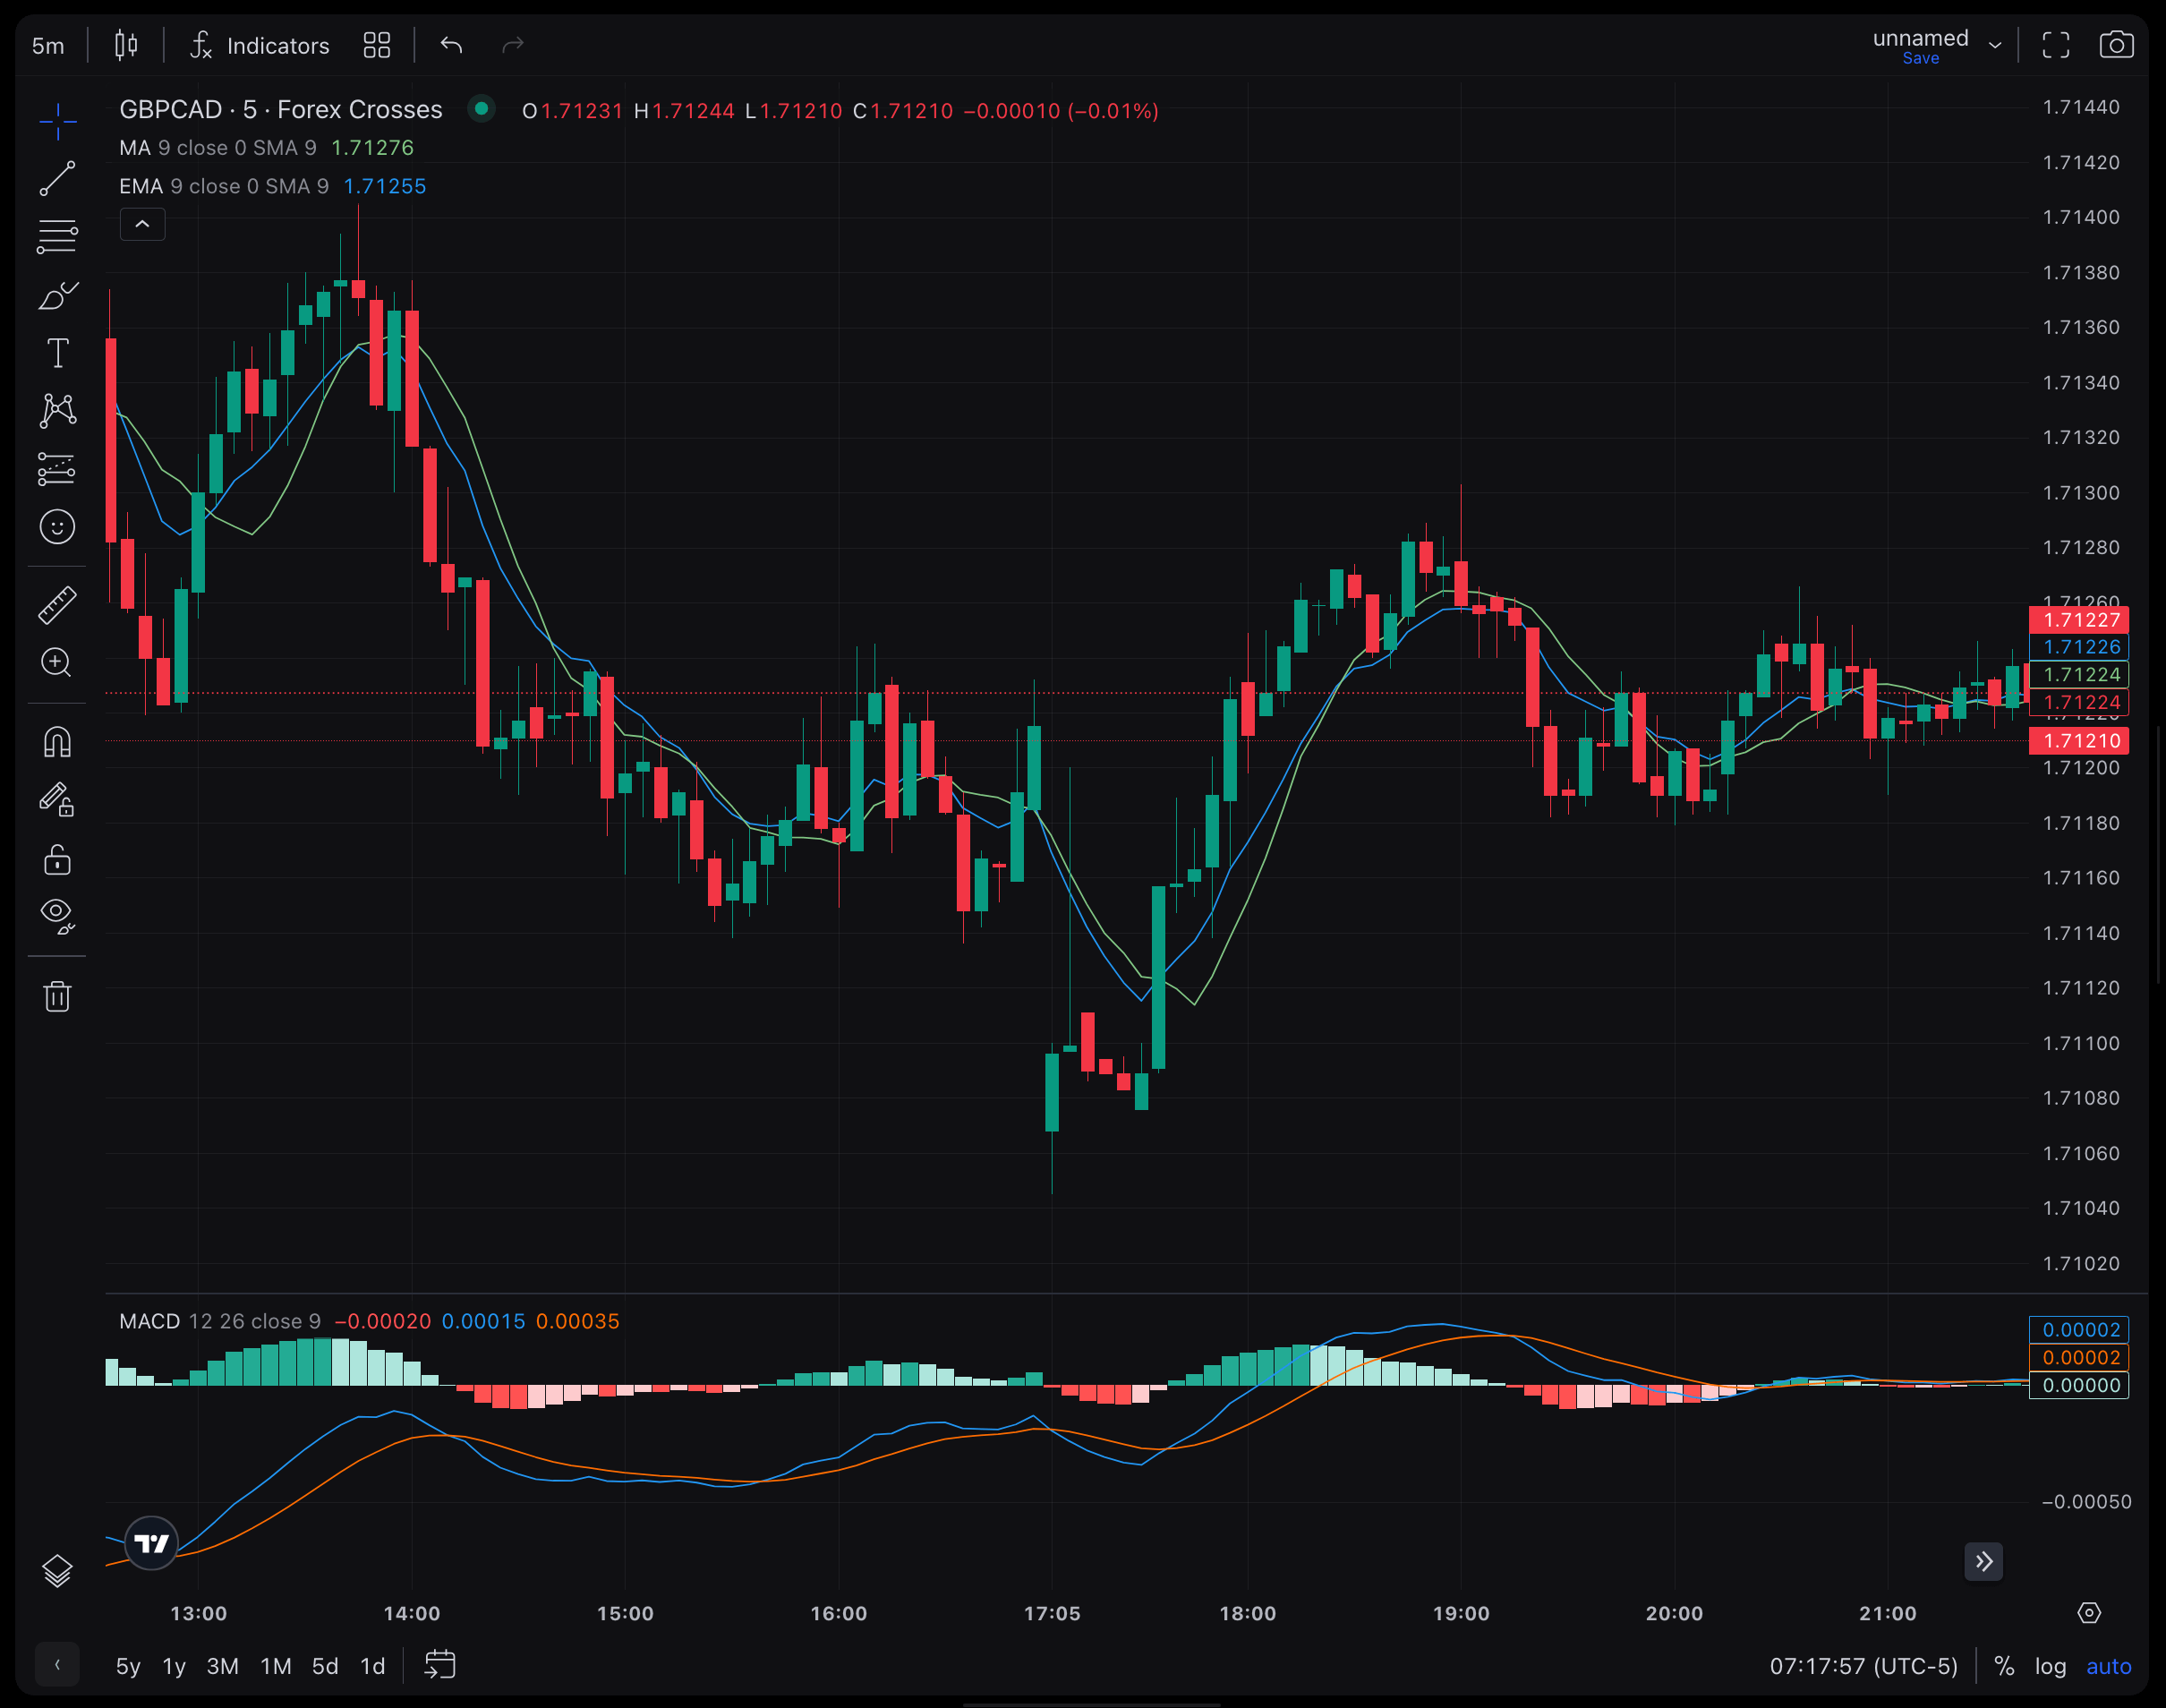
Moving Averages (MAs)
A moving average calculates the average price of an instrument over a specified period, commonly using intervals of 9 days, 14 days, 50 days, or 200 days, though you can adjust these according to your strategy.
In trend trading with moving averages, you assess whether the price is above or below the average. If it’s below the MA, it suggests that the price might reverse upward, initiating a new bullish trend. Conversely, if the price is above the MA, you’d be on the lookout for a potential downward reversal into a bearish trend.
For instance, if you intend to enter a long position, you may wait for the market to approach the 50-day MA. Once the price aligns with the indicator, you’d then wait for a favorable candle to close before entering on the subsequent candle. This approach allows the uptrend to be confirmed before committing to the trade.
Traders should then establish a stop-loss level below their entry point to mitigate potential losses if the market takes a downturn instead of resuming its upward momentum.
It’s crucial to keep in mind that a moving average is a lagging indicator, meaning it reflects past price data rather than forecasting future movements. This is why it’s typically used as one component of a broader trading system.
Many traders employ multiple moving averages of different timeframes on a price chart and monitor their crossovers. This approach involves waiting for slower-moving averages to intersect with faster-moving averages, serving as buy and sell signals. For instance, if a 9-day MA crosses above a 21-day MA, it may signal an opportunity to go long in the market.
Relative strength index (RSI)
The Relative Strength Index (RSI) is a popular tool among trend traders because it serves as a momentum indicator. This means it assesses the strength of prevailing trends, offering insights into whether there is sufficient momentum behind the movement for it to persist or if it’s too weak and likely to reverse.
The RSI evaluates the pace at which buyers are making purchases and sellers are executing sales. It calculates the average of days when the market closes higher versus days when it closes lower and expresses the result on a scale from 1 to 100.
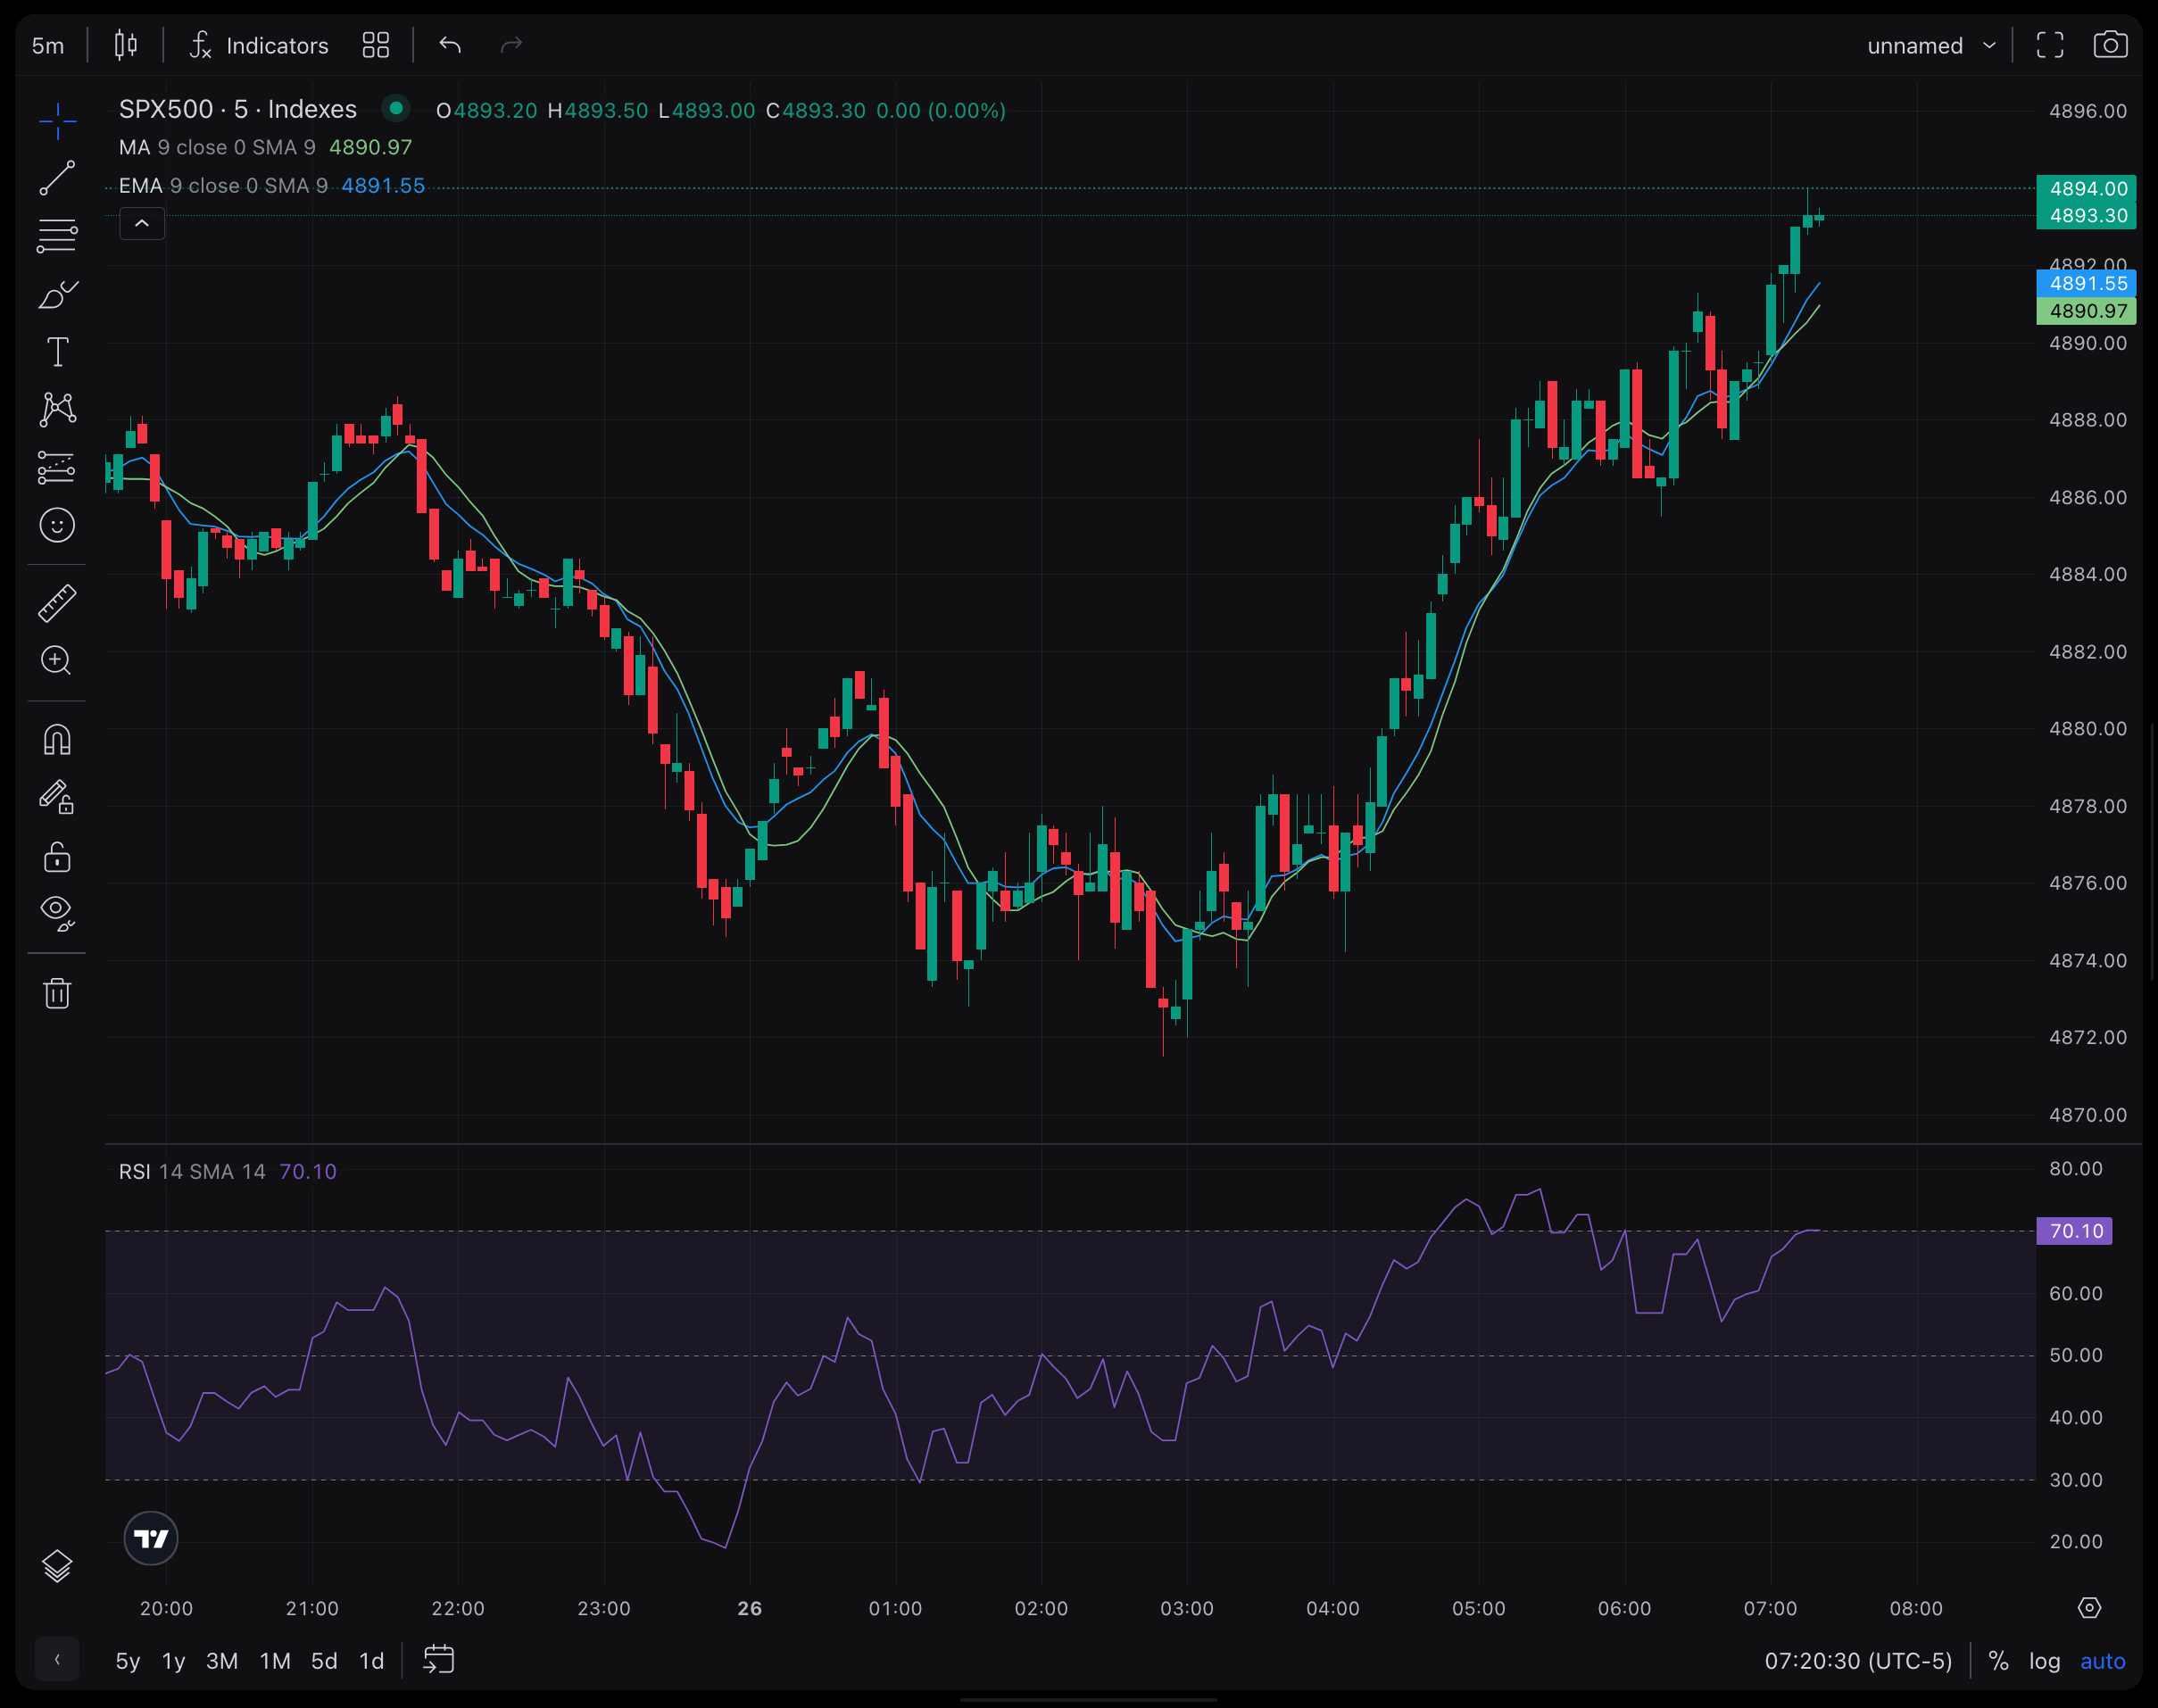
When the RSI reading falls below 30, it suggests that the market is in an oversold condition. This often corresponds to potential reversal points, as more buyers interpret this as an indication that the asset is attractively priced.
On the other hand, when the RSI reading exceeds 70, it indicates the opposite scenario. The market is considered overbought, and this can foreshadow an influx of sellers leading to a reversal in an uptrend.
The RSI can be effectively incorporated into a retracement strategy. For instance, in the context of an uptrend, if the RSI dipped below the 30 level before rebounding, it might signal that the overall uptrend is set to continue. This indicator suggests that the price briefly retreated into oversold territory but is now resuming its ascent in alignment with the existing trend. This concept is illustrated in the S&P 500 price chart below.
As with any indicator, it’s important to understand that these signals are not 100% accurate and can provide false signals. So, it’s necessary to attach risk management tools to any positions, such as stop losses, trailing stops or guaranteed stops.
Boillinger bands
Bollinger Bands are another widely used tool to identify overbought and oversold levels in the market.
This tool consists of three key lines:
1. The middle band: This represents a 20-day simple moving average (SMA).
2. The upper band: This is calculated as the SMA plus twice the daily standard deviation.
3. The lower band: This is determined as the SMA minus twice the daily standard deviation.
When the price of an asset breaks below the lower Bollinger Band, it is often interpreted as a signal that prices have declined too much within a downtrend, and a potential reversal into a new uptrend may be on the horizon.
Conversely, when the price surpasses the upper Bollinger Band, it suggests that the market is overbought and could be due for a downward reversal. For instance, in a given chart, if the price extends beyond the upper band, it may mark the beginning of a downtrend.
Bollinger Bands can also be applied in situations of weak trends, such as range-bound markets, where prices tend to fluctuate between the upper and lower bands.
Many trend traders utilize Bollinger Bands primarily as a guide for entry and exit rather than as a predictor of the trend’s direction. This is because markets can remain in overbought or oversold conditions for extended periods.
For instance, in a downtrend, a trader might consider taking a short position when the upper band is reached. However, in a declining market where the lower band is touched, one would refrain from opening a long position until there is clear confirmation of a full trend reversal. Nevertheless, the lower band can still be used as a reference point for placing stop-loss orders.
It is essential to emphasize the importance of combining multiple indicators and analysis tools to validate signals and implement risk management measures to safeguard trades effectively.