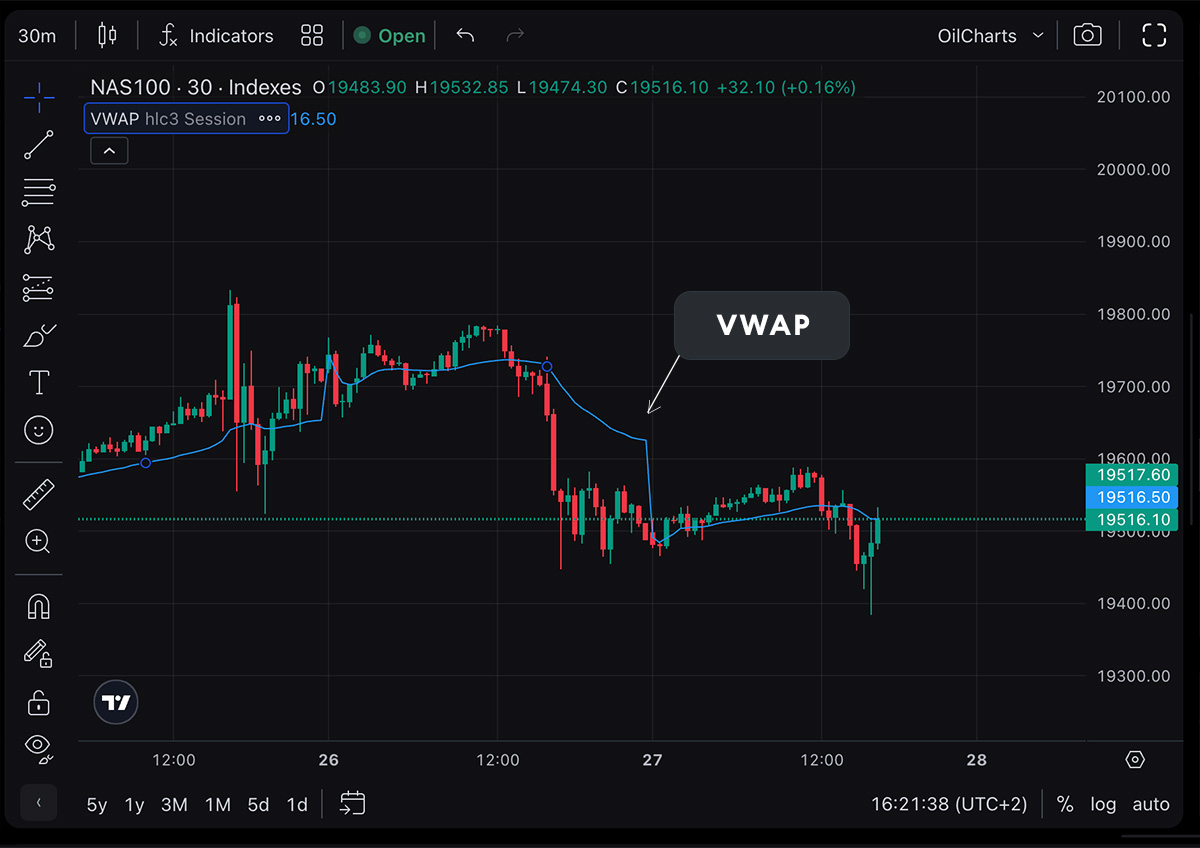
What is VWAP?
VWAP, or Volume Weighted Average Price, is a trading benchmark that represents the average price of a security, adjusted for its trading volume over a specific period—typically a single trading day. Unlike simple moving averages that consider only price, Volume Weighted Average Price provides a more comprehensive view by incorporating both price and volume. This dual consideration makes Volume Weighted Average Price a vital tool for traders aiming to understand market sentiment and price trends.
The VWAP Formula Explained
Understanding the Volume Weighted Average Price formula is essential for grasping how the indicator works:
$$
\text{VWAP} = \frac{\sum_{i=1}^{n} P_i \times V_i}{\sum_{i=1}^{n} V_i}
$$
Where:
– \( P_i \) = Price at time interval \( i \)
– \( V_i \) = Volume at time interval \( i \)
– \( n \) = Total number of intervals
This formula calculates the cumulative total of price-volume products divided by the cumulative total volume, providing a weighted average that reflects both the price at which most trading activity occurred and the volume of trades.
How to Use VWAP in Trading
Day Trading with VWAP
For day traders, VWAP is an invaluable indicator:
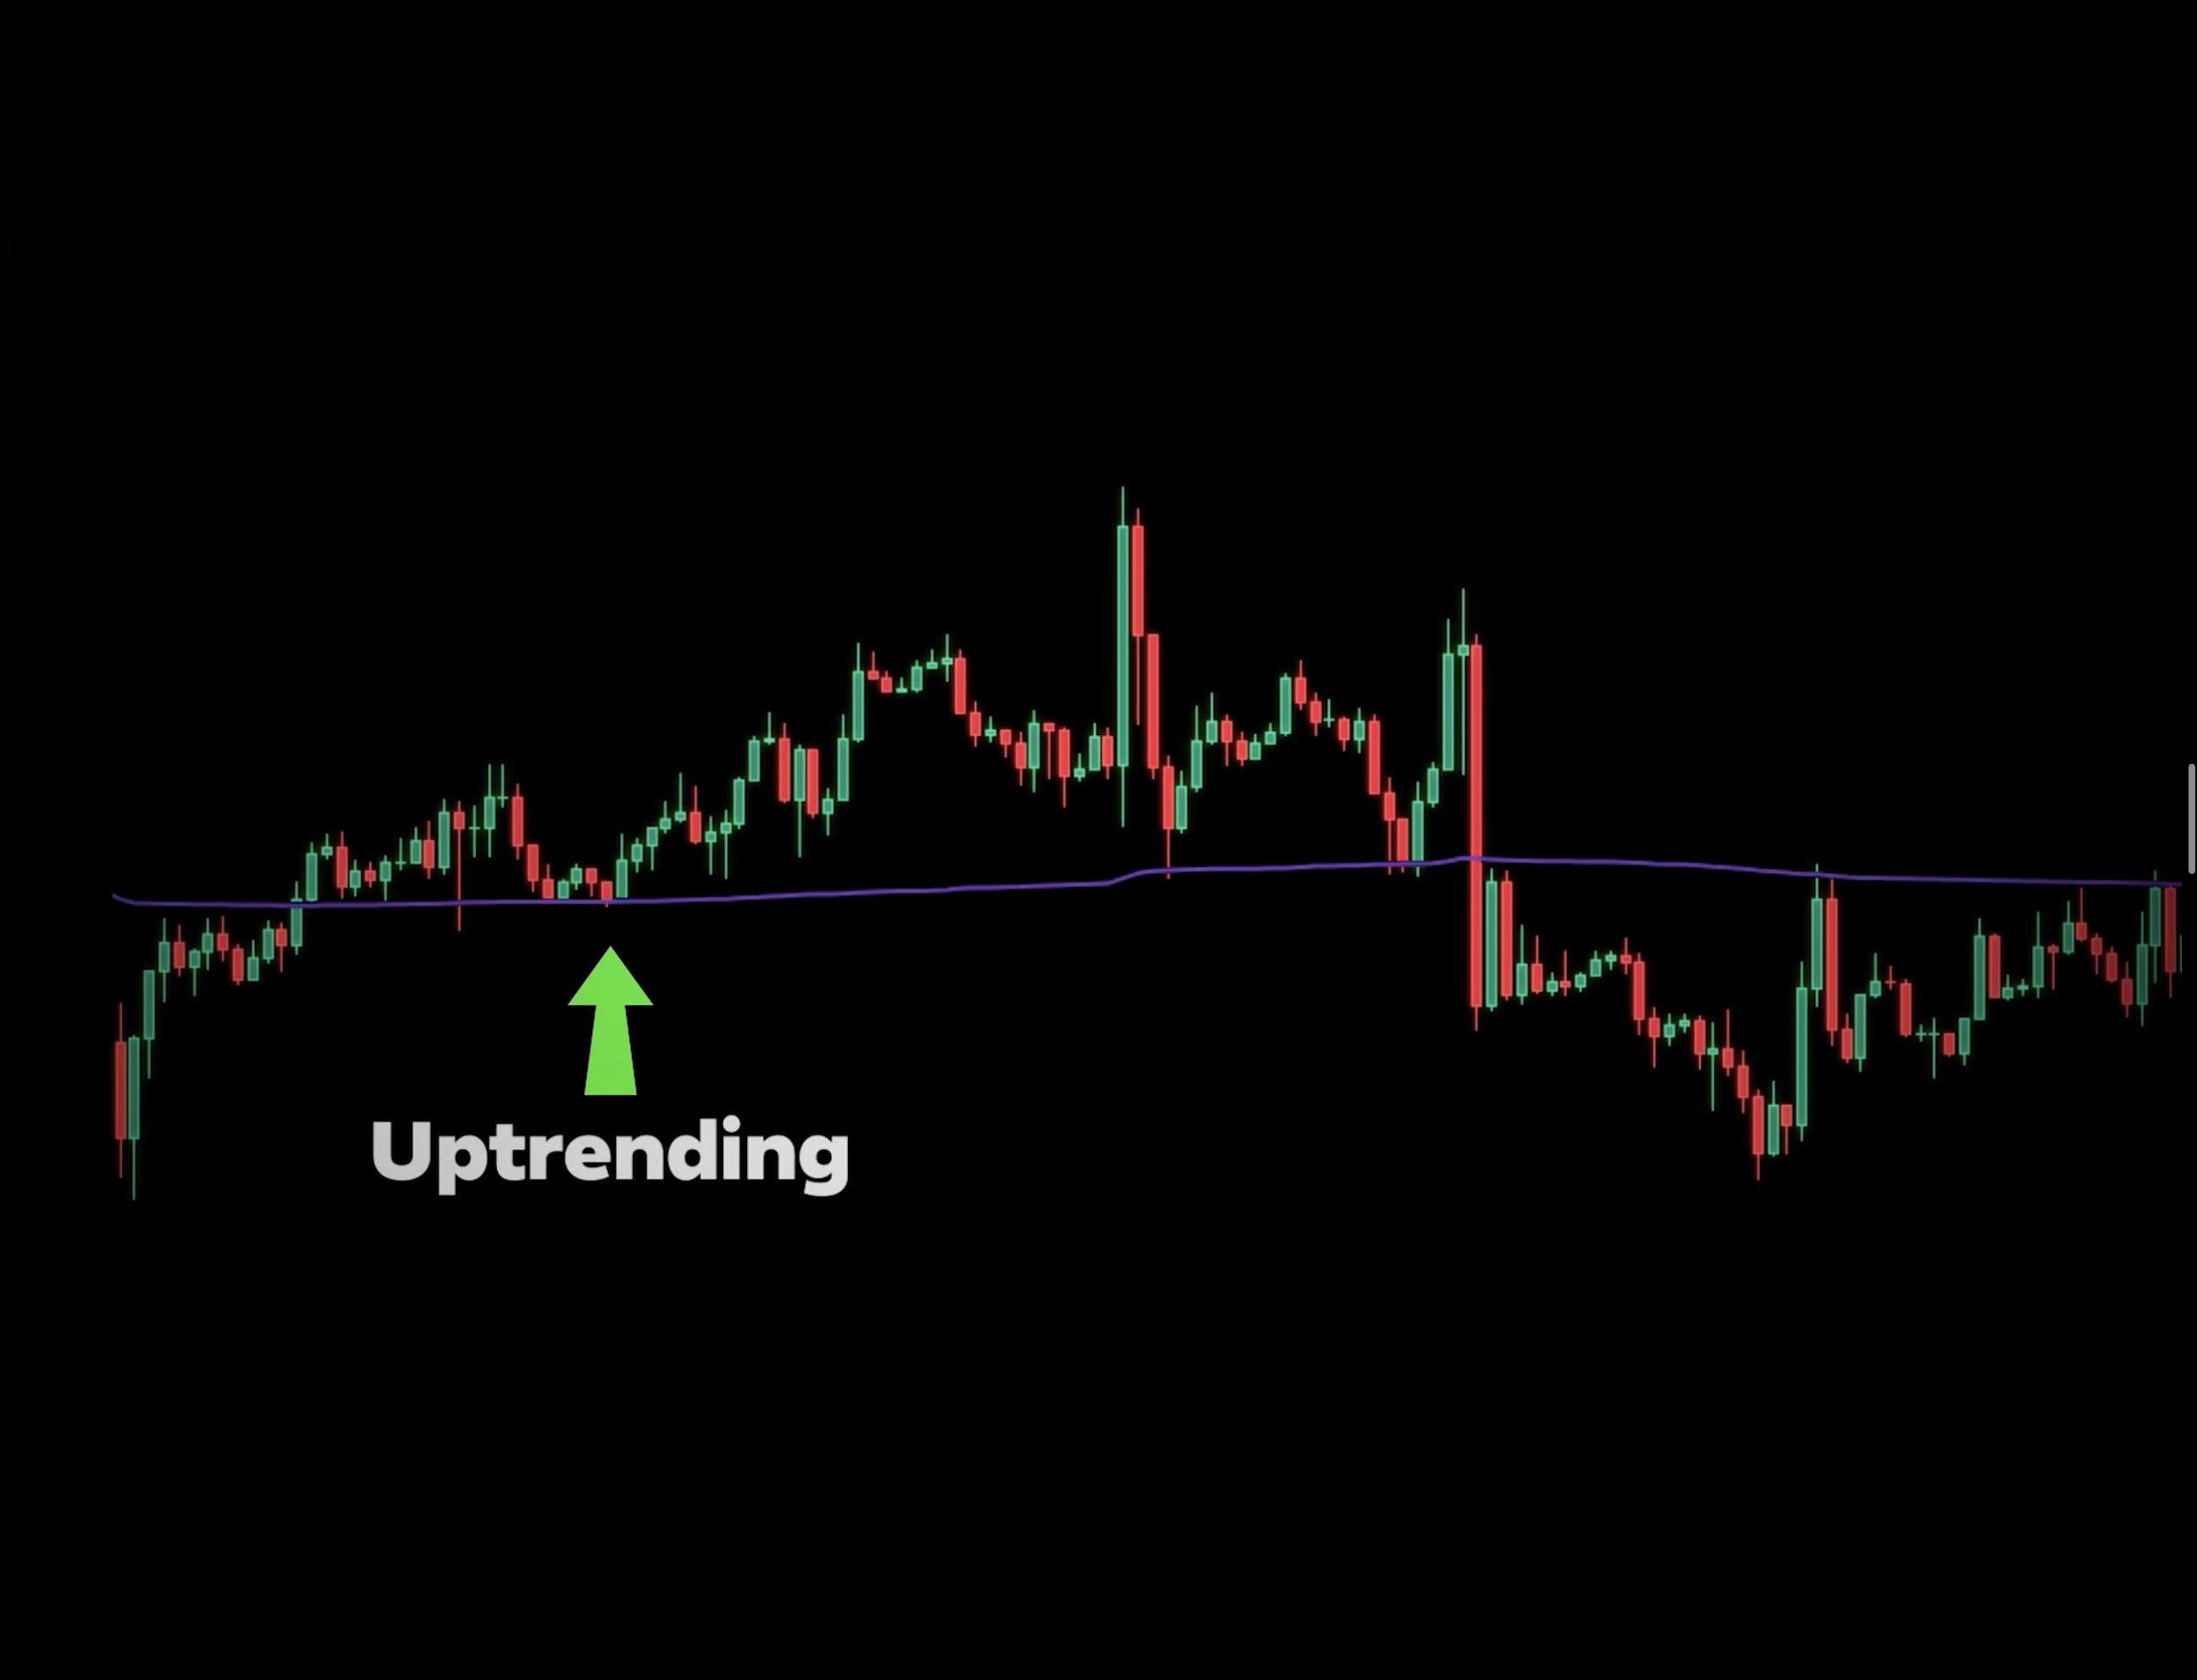
- Above VWAP: If a stock is trading above the Volume Weighted Average Price line, it’s considered bullish. This suggests buyers are willing to pay higher prices, indicating upward momentum.
- Below VWAP: Trading below the Volume Weighted Average Price line is bearish, implying sellers are dominating, and prices may continue to decline.
VWAP as Support and Resistance
VWAP can act as a dynamic support or resistance level:
- Support: In a rising market, the Volume Weighted Average Price line may serve as a support level where traders look for buying opportunities.
- Resistance: In a falling market, the Volume Weighted Average Price line can act as a resistance level, signaling potential selling points.
VWAP Strategies for Traders
Crossover Strategy
One popular VWAP strategy involves monitoring crossovers:
- Buy Signal: When the stock price crosses above the Volume Weighted Average Price line from below, it may indicate a good entry point for a long position.
- Sell Signal: Conversely, when the price falls below the Volume Weighted Average Price line from above, it could be a signal to sell or short the stock.
Combining VWAP with Other Indicators
Enhance your Volume Weighted Average Price strategy by combining it with other technical indicators:
- Moving Averages: Confirm trends by using Volume Weighted Average Price alongside moving averages.
- Relative Strength Index (RSI): Use RSI to gauge overbought or oversold conditions in conjunction with Volume Weighted Average Price signals.
- MACD: The Moving Average Convergence Divergence can help confirm momentum shifts identified by Volume Weighted Average Price.
Anchored VWAP vs. Regular VWAP
Anchored VWAP starts its calculation from a specific point in time or event, rather than resetting each day like the regular Volume Weighted Average Price. This allows traders to:
- Analyze price movements relative to significant events (e.g., earnings reports, market crashes).
- Identify long-term support and resistance levels based on cumulative volume since the anchor point.
Benefits of Anchored Volume Weighted Average Price:
- Provides a contextual view of price action over extended periods.
- Helps in identifying institutional buying or selling zones.
VWAP vs. TWAP: Understanding the Differences
While both are average price benchmarks, VWAP and TWAP serve different purposes:
- VWAP (Volume Weighted Average Price):
- Considers both price and volume.
- Best for understanding where most trading activity occurred.
- Useful for intraday trading and assessing liquidity.
- TWAP (Time Weighted Average Price):
- Averages price over time intervals without considering volume.
- Ideal for executing large orders evenly over time to minimize market impact.
- Less responsive to sudden volume spikes.
Limitations
Despite its advantages, Volume Weighted Average Price has limitations:
- Lagging Indicator: Volume Weighted Average Price is based on historical data, which may cause delays in signaling real-time market shifts.
- Not Suitable for Long-Term Analysis: Since it resets daily, Volume Weighted Average Price is less effective for long-term trend analysis without anchoring.
- Volume Dependency: In stocks with low trading volume, Volume Weighted Average Price may provide less reliable signals.
Conclusion
Incorporating VWAP into your trading strategy can offer deeper insights into market dynamics. By understanding it and utilizing the indicator effectively, traders can identify optimal entry and exit points, gauge market sentiment, and improve trade execution. Remember, while Volume Weighted Average Price is powerful, it should be used in conjunction with other indicators and analysis methods to make well-rounded trading decisions.