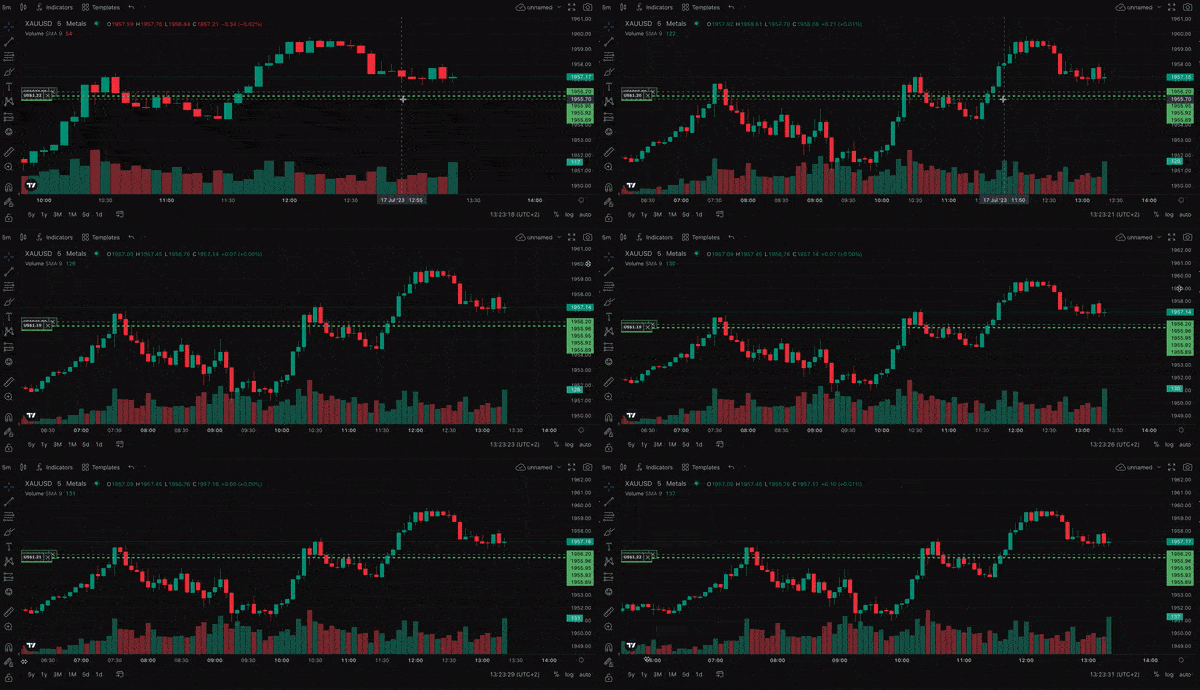
Increasing and changing the candle size in TradeLocker can be done in several ways. It is similar to zooming in and out.
Adjusting the size of the candles on a candlestick chart can help traders focus on different time frames and levels of detail. For instance, using larger candles, representing longer time intervals like daily or weekly, can help identify long-term trends and support or resistance levels.
Smaller candles, like those on a 1-minute or 15-minute chart, can be useful for short-term traders such as day traders or scalpers. These allow for a more granular view of price action and may reveal patterns or signals not visible on longer timeframes.
Changing candle size is a simple yet effective way to tailor the chart to your specific trading needs and strategy.
Here’s how to adjust the candle size:
- At the bottom of the x-axis, your cursor will turn into a double arrow which you can drag left or right to make the chart appear bigger or smaller. You can also hold the left mouse click and then scroll left or right to change the size.
- On the right side of the y-axis, your cursor will turn into a double arrow which you can drag up or down to make the chart appear bigger or smaller. You can also hold the left mouse click and then scroll up or down to change the size.
- Another way is to change the size is to hold CTRL or Command (on Mac) and then scroll up or down with your mouse. Doing this will expand the candle chart on the x-axis.

Help us build the perfect trading platform that prioritizes your needs and preferences. Join our Discord community to meet the TradeLocker team and other traders, discuss upcoming features, and chat with us directly.