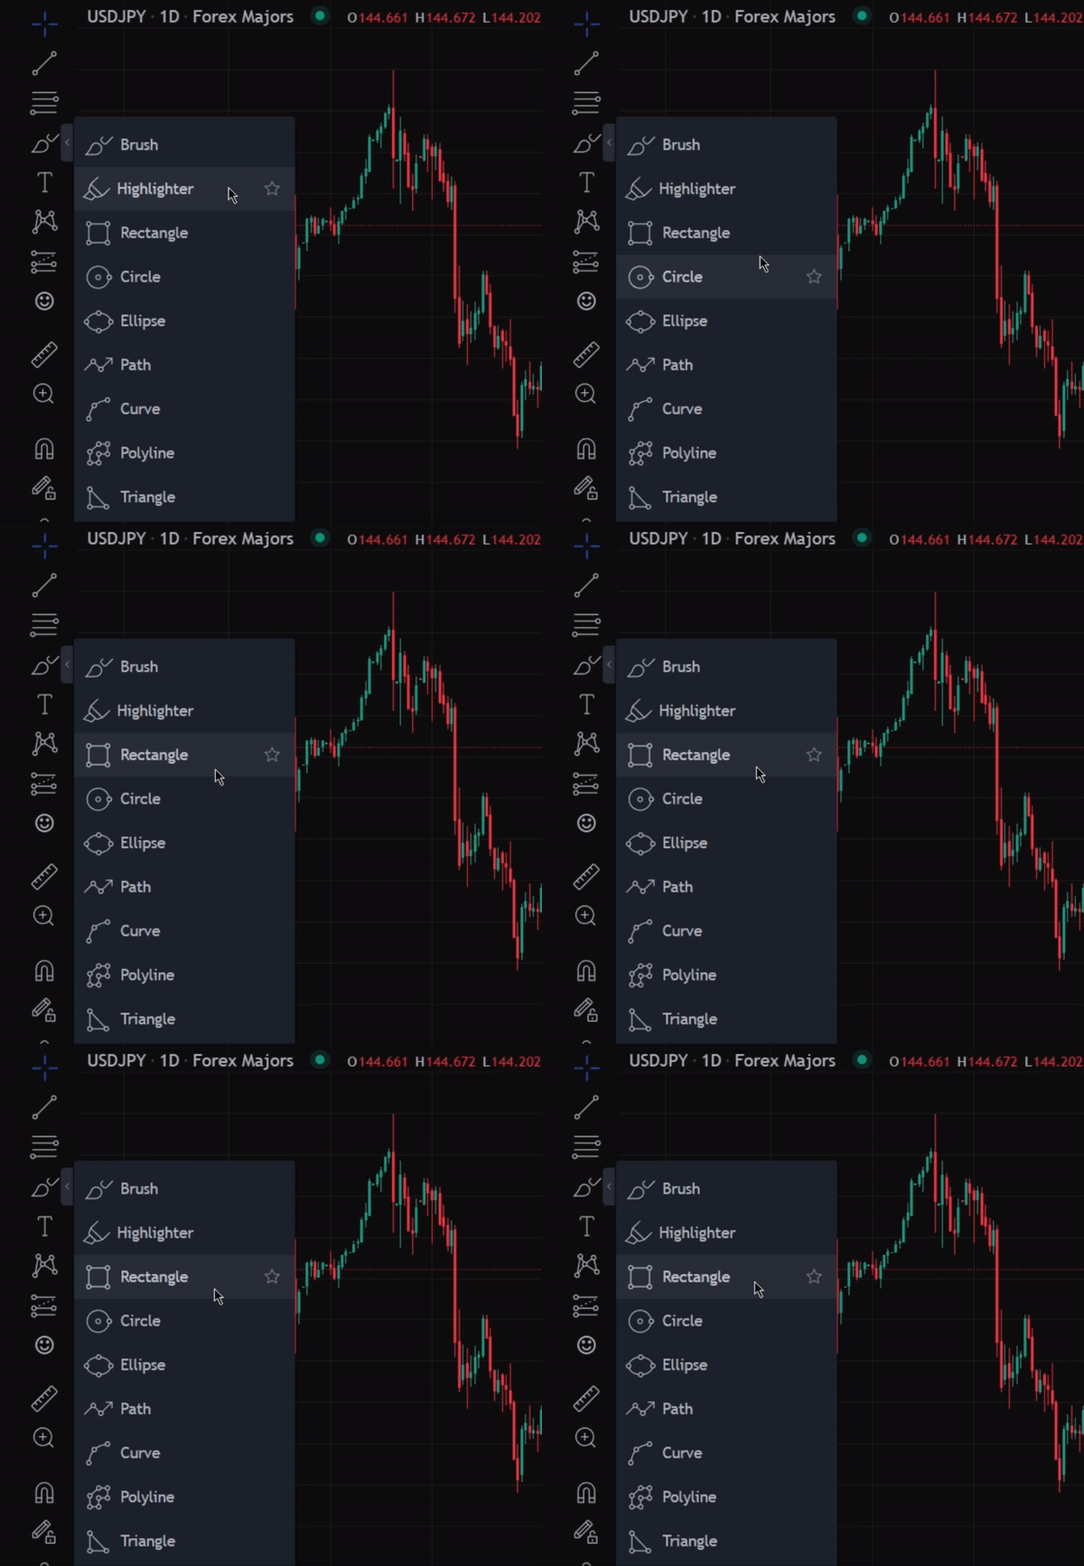
The rectangle tool is a useful feature on TradeLocker that allows you to draw rectangles on the chart. It is useful for highlighting specific areas on the chart such as consolidation patterns, price ranges or breakout zones.
The rectangle tool makes it easier to identify key zones of interest on your chart. By framing consolidation patterns, it helps anticipate potential breakouts or breakdowns. Drawing rectangles around price ranges can assist in setting stop-loss or take-profit levels.
This tool is also valuable for marking historical support and resistance zones, providing context for current price action. Overall, it enhances your chart’s readability, allowing for a quicker interpretation of complex patterns and levels.
Usage
- Select the instrument of currency pair you want to analyze on the chart.
- Find the rectangle tool icon which is represented by a rectangle shape, and click on it to activate it.

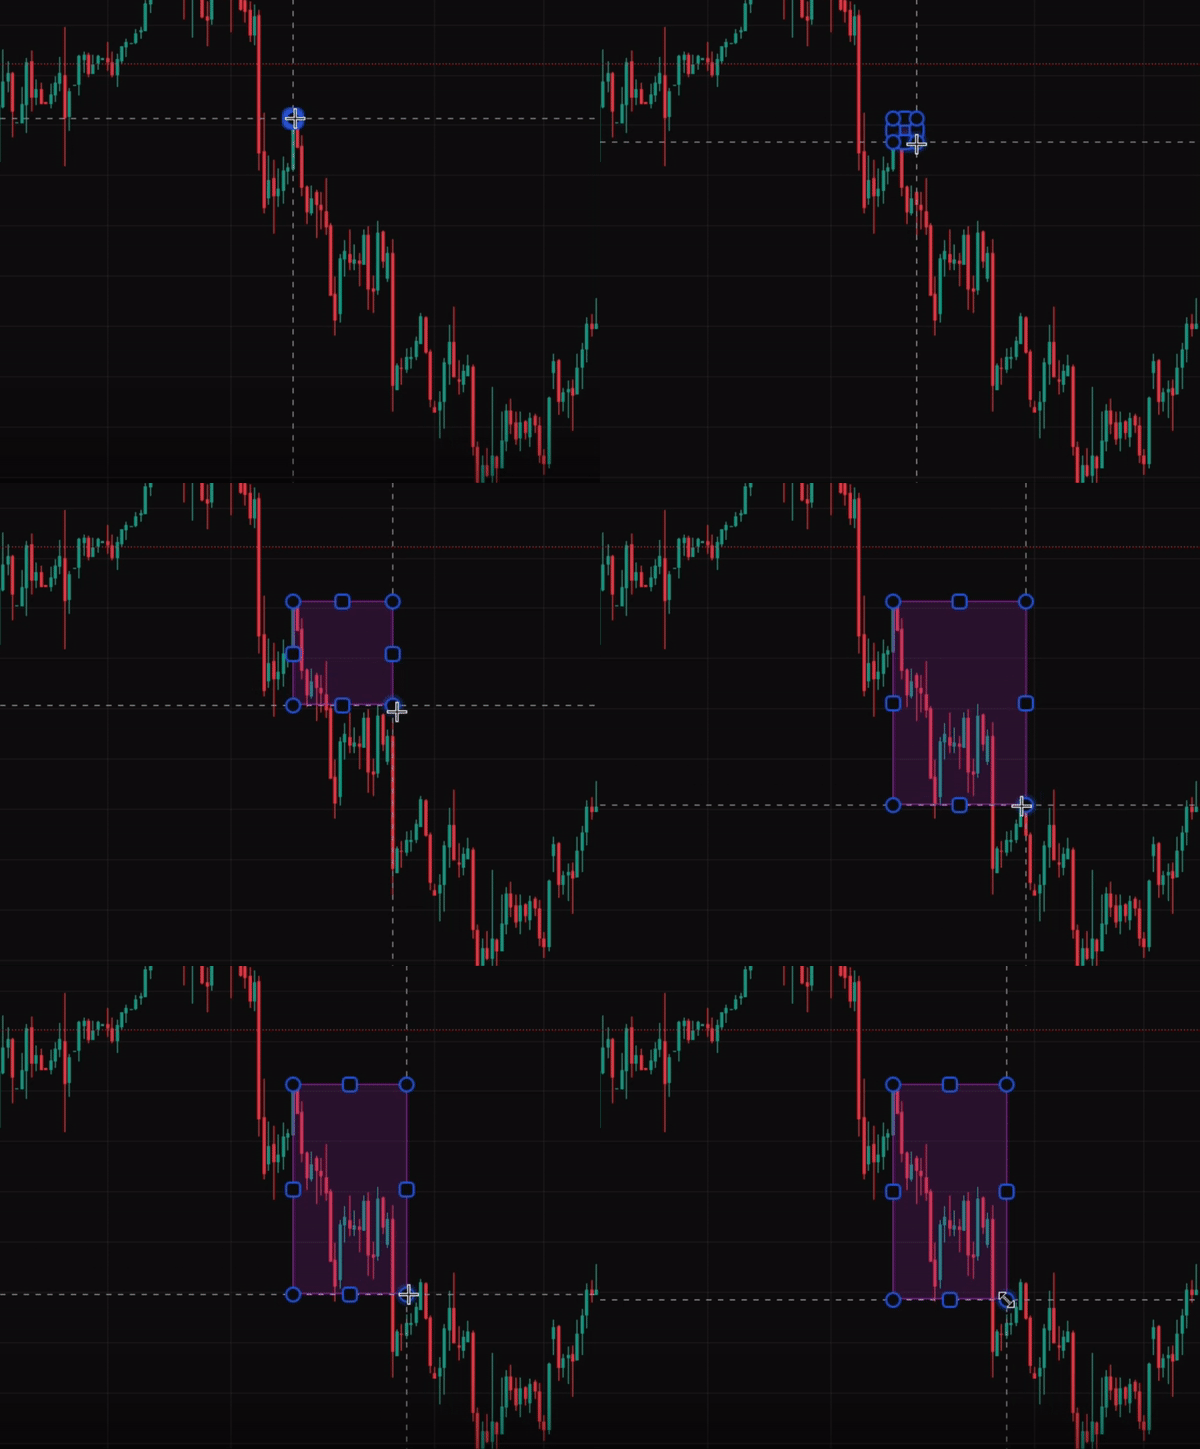
- Position the cursor at the starting point of the rectangle and click the left mouse button to place the first corner.
Think outside of the box
- Drag the cursor to the desired position for the opposite corner of the rectangle and click again at the left mouse button to complete the rectangle.

Help us build the perfect trading platform that prioritizes your needs and preferences. Join our Discord community to meet the TradeLocker team and other traders, discuss upcoming features, and chat with us directly.