Creating a chart template allows you to save and apply predefined chart configurations, saving you time and effort in settings and preferred chart layout.
By saving specific indicators, time frames, and graphical elements in a template, you ensure consistency in your analyses, which is vital for accurately tracking performance and making adjustments to your trading strategies. Furthermore, templates can be incredibly versatile.
For example, you could have a template specifically designed for volatile markets that incorporates higher sensitivity indicators, or another one optimized for long-term investments that focuses on moving averages and trend lines.
Some advanced charting platforms even allow you to integrate custom scripts into your templates, enabling you to automate specific tasks or alerts, further enhancing your trading efficiency and responsiveness to market changes.
How to create a chart template
Create a chart
The first step is to create a template to your liking, here are some tips on how to use TradingView indicators in TradeLocker.
Look for the template icon
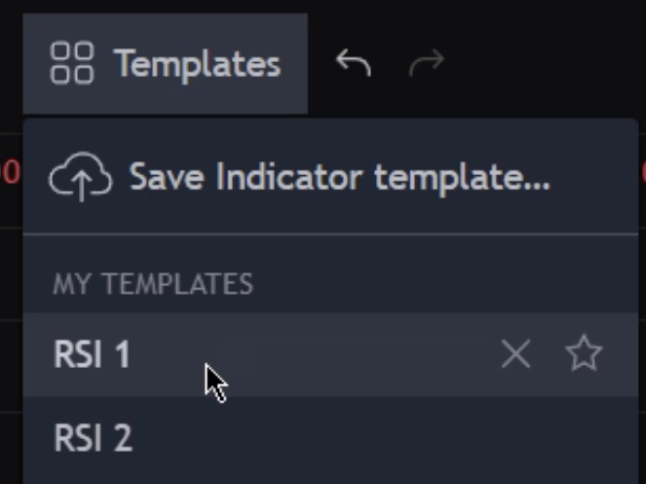
Once you have created a chart that you like, look for the chart template option on the top left part of the screen.

Input the name
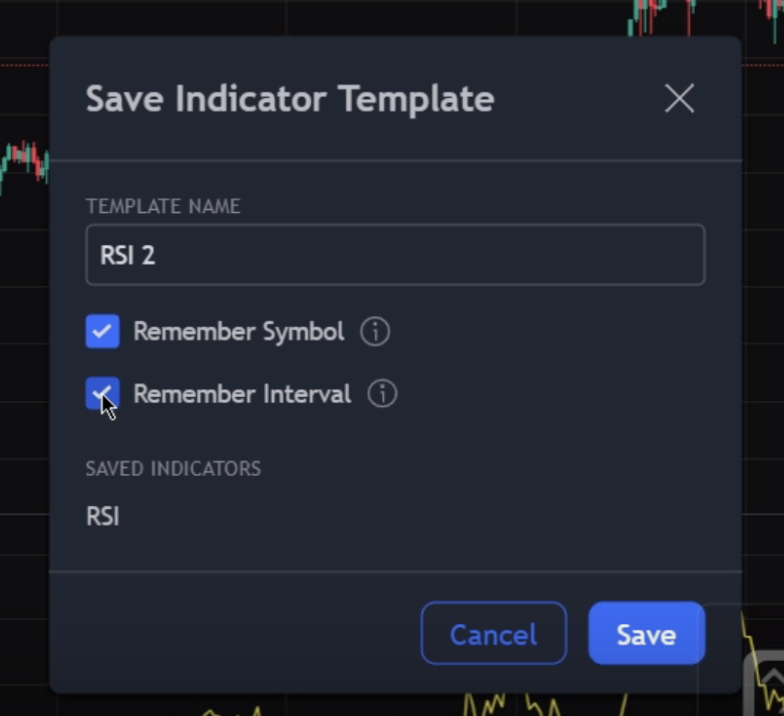
Click on it and then a pop-up will appear where you can choose the template name and decide whether or not to include the symbol and the timeframe in the template.

Apply the Saved Template
After saving the template, you can apply it to any chart on TradeLocker. Click on the template option within the chart section and select the desired template from the list that will appear. The chart will update to reflect the same configurations including the indicators, timeframes and other elements.

Help us build the perfect trading platform that prioritizes your needs and preferences. Join our Discord community to meet the TradeLocker team and other traders, discuss upcoming features, and chat with us directly.