The horizontal line tool is a useful feature on TradeLocker that allows you to draw horizontal lines on the chart. You can use the horizontal line tool to identify support levels, resistance levels, and other reference points on the chart. These lines can help you pinpoint areas of interest for your trading, such as potential entry and exit points.
The horizontal line tool is fundamental for any trader’s technical analysis toolkit. It provides a straightforward way to mark key price levels. By drawing these lines, you get a clear visual representation of supply and demand zones.
Furthermore, you can use this tool in tandem with indicators like moving averages or RSI to validate signals. Additionally, these lines can serve as the foundation for more complex chart patterns, adding depth to your analysis.
Select the asset and pick a tool
- Select the instrument or currency pair you want to analyze on the chart.
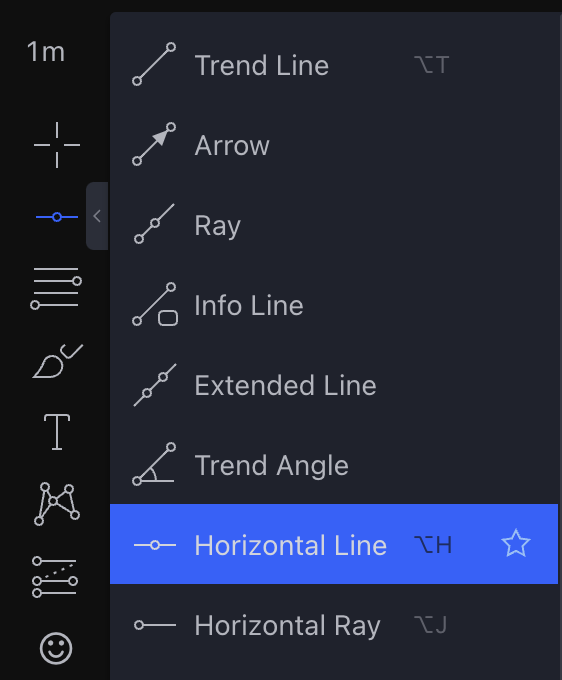
- On the left-hand side of the chart, you’ll find a toolbar or menu that contains the drawing tools.
- Look for the horizontal line tool icon, which is represented by a horizontal line.
Draw on the chart
Position the cursor at the point where you want to draw the horizontal line. Click the left mouse button to place the line.
Remember to use horizontal lines in conjunction with other technical analysis tools and indicators to make more informed trading decisions.
Help us build the perfect trading platform that prioritizes your needs and preferences. Join our Discord community to meet the TradeLocker team and other traders, discuss upcoming features, and chat with us directly.