Every trader recalls trades that seemed like sure wins, but once they jumped in, the trades reversed and resulted in losses.
These are called “trap trades,” which entice traders and then turn sharply once they’re committed.
A well-known example among traders is the bull trap. In this article, we’ll define what a bull trap is, show how to identify one, discuss how to steer clear of them, and then explore some strategies to potentially profit from trading them.
What Is A Bull Trap?
A bull trap occurs during an uptrend. The asset’s price rises until it hits a resistance level. Initially, it shows a pause, as expected by traders, then it appears to break through the resistance.
This pattern is deceptive as it may falsely “confirm” a breakthrough, leading traders to think the bull rally is continuing, prompting them to place buy orders.
Unfortunately, soon after, the price sharply reverses, beginning a bearish trend. Traders with stop-loss orders get them triggered, while others are left with losing positions.
Understanding a Bull Trap
Psychological Aspects
Bull traps appear when there isn’t enough momentum to keep the rally going above the breakout level. This situation often arises from reasons such as profit-taking or a swift shift in market sentiment. Spotting these indicators, bears usually start selling, pushing the price down below the resistance level. This movement then activates the stop-loss orders of traders caught in the trap.
How Can I Identify Bull Trap?
Identifying a bull trap can be easy if you know what you are looking for. Following are some common tell-tale signs the bull trap will occur.
1. Multiple Testing of Resistance Level
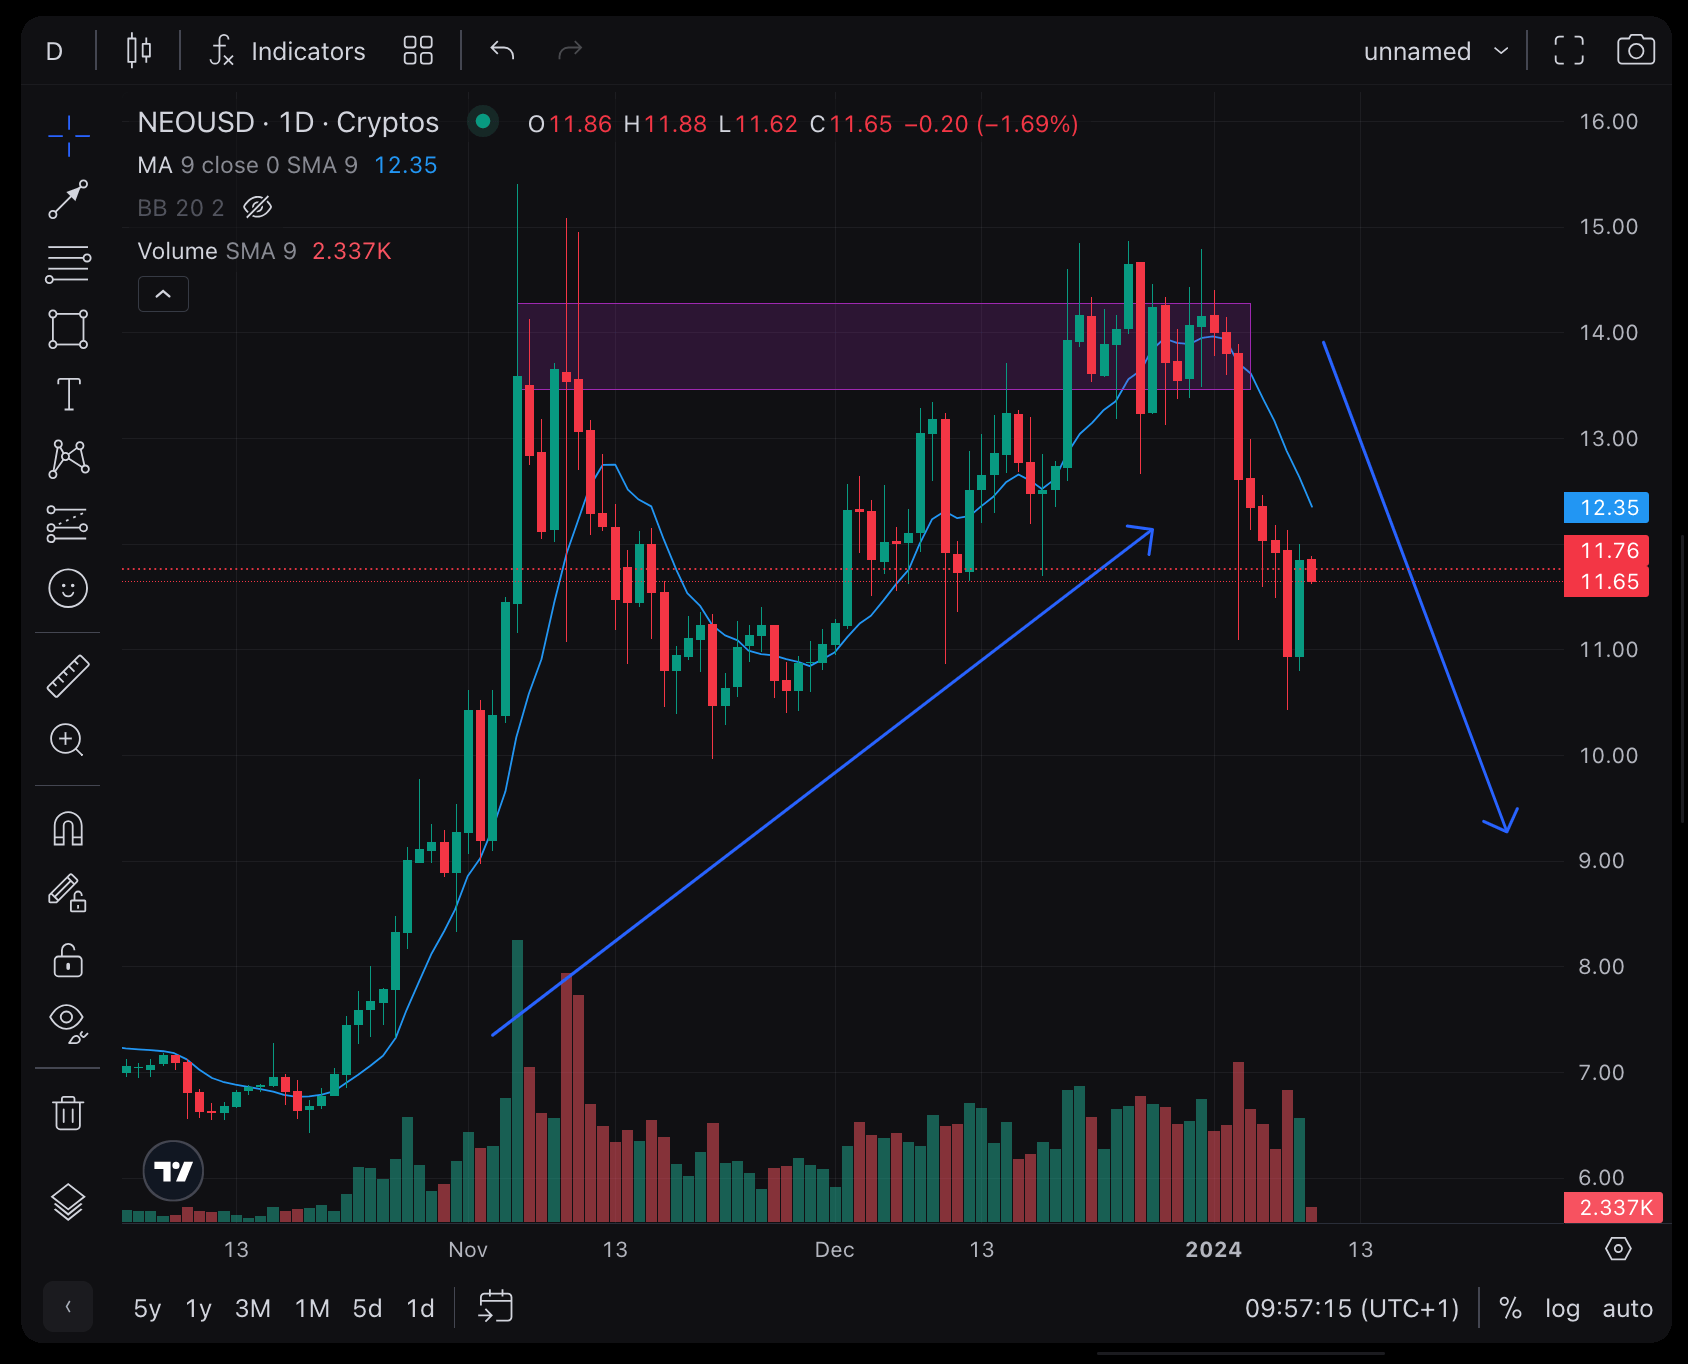
The initial sign of an impending bull trap is a robust bullish trend that’s been ongoing for an extended period, yet shows a notable reaction when it encounters a particular resistance zone.
This type of uptrend, characterized by minimal resistance from bears, indicates that buyers are heavily investing. However, upon reaching a specific resistance level, there’s often a sense of hesitation or caution from the buyers, leading to a temporary pullback in price before it attempts to climb even higher.
In the scenario described, it’s clear that the bulls dominated the price movement for a considerable duration.
Yet, when the price hit the designated resistance level, there was a noticeable slowdown and a slight pullback before attempting to push higher. This pattern, evidenced by three tests before the bull trap occurred, is a critical observation.
Therefore, a key method to spot a potential bull trap is to observe significant pauses at a resistance level following a lengthy, sustained uptrend. These pauses can signal a shift in market dynamics, potentially leading to a bull trap.
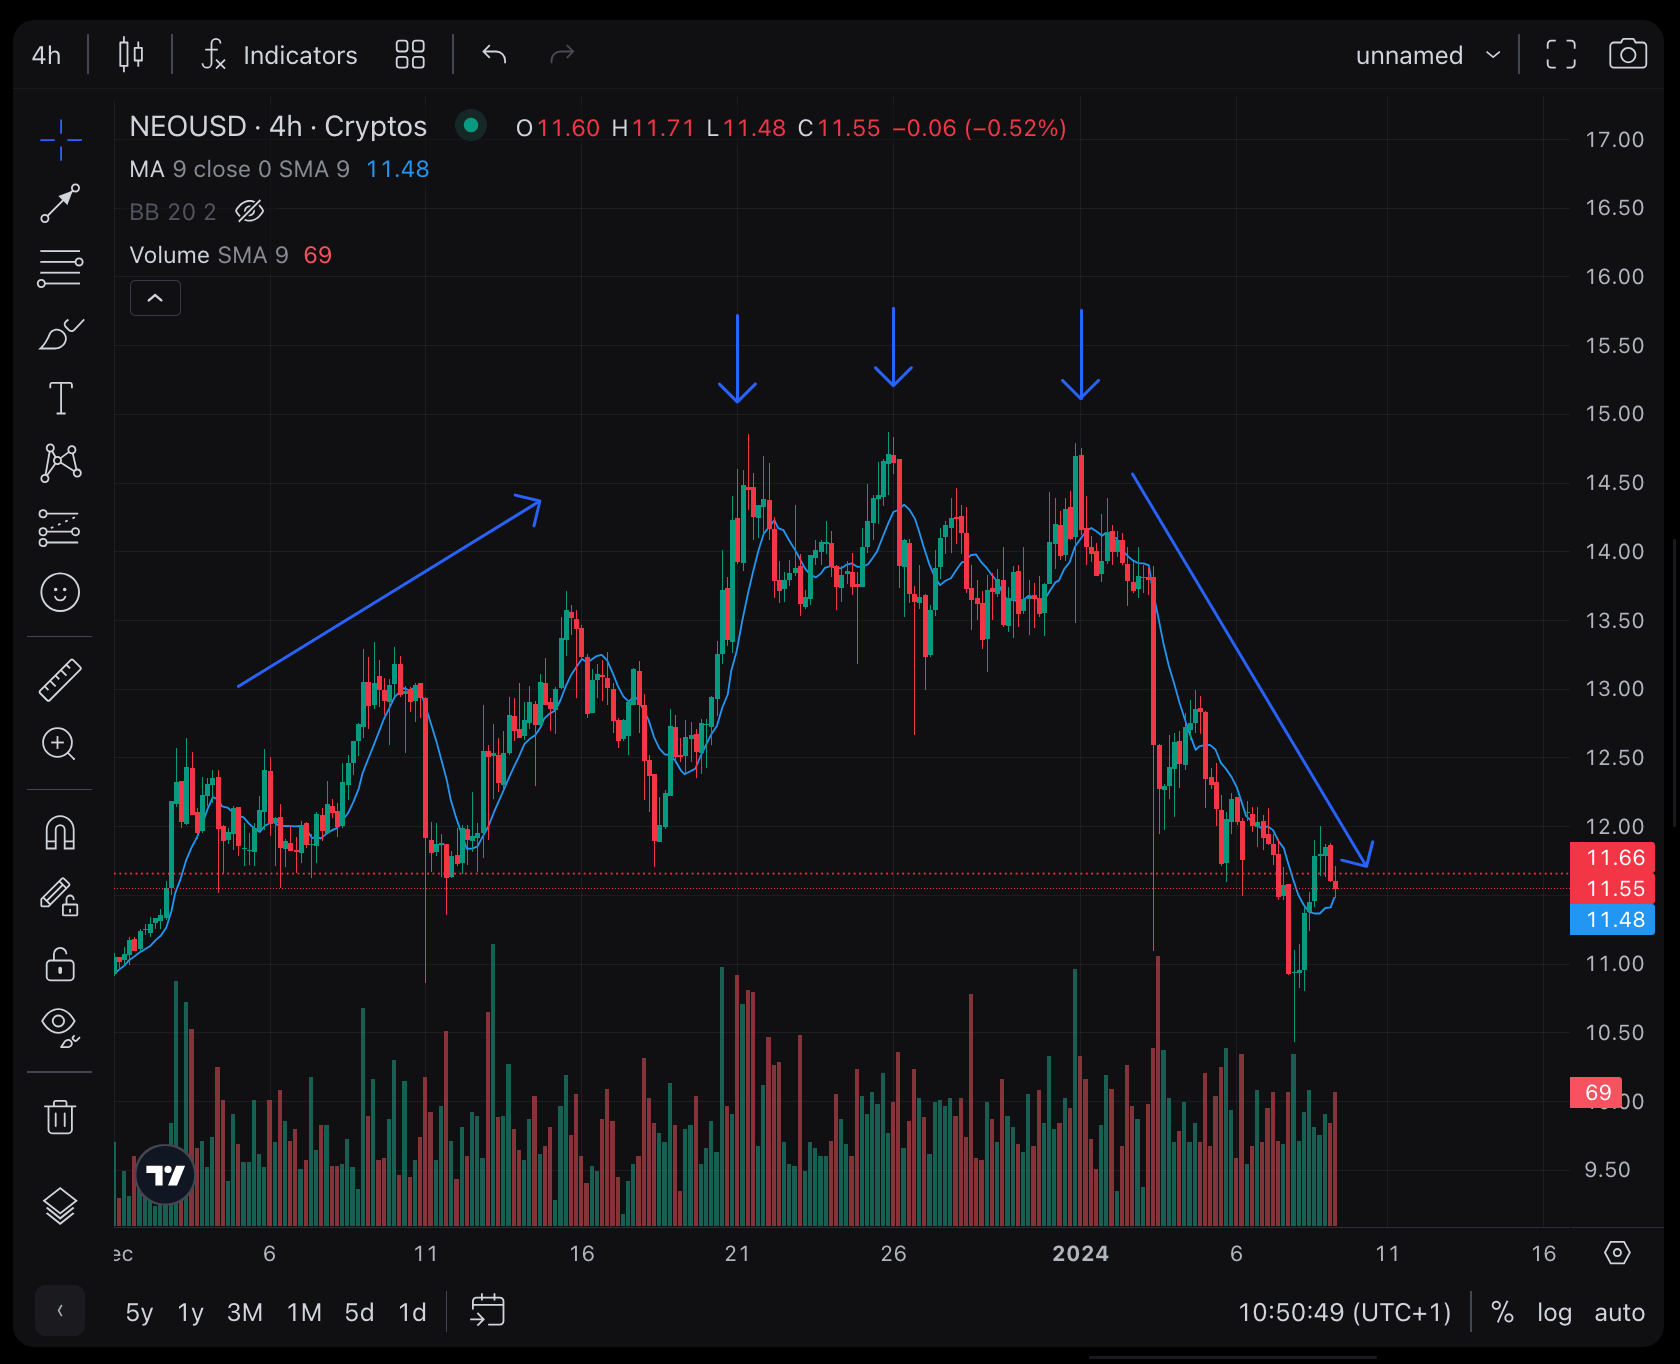
2. Unusually Huge Bullish Candlestick
In the final stage of a bull trap, a notably large bullish candle often emerges, overshadowing most of the preceding candlesticks on its left.
There are several possible explanations for this candlestick:
- New buyers might interpret this as a breakout and begin purchasing again.
- It could be a strategy by major players to artificially drive the price up, attracting more buyers.
- Alternatively, sellers might deliberately allow buyers to control the market for a short period, activating sell limit orders placed above the resistance zone.
Reviewing the two previously mentioned images, you’ll notice that a significant bullish candle indeed appears right before the trap is set.
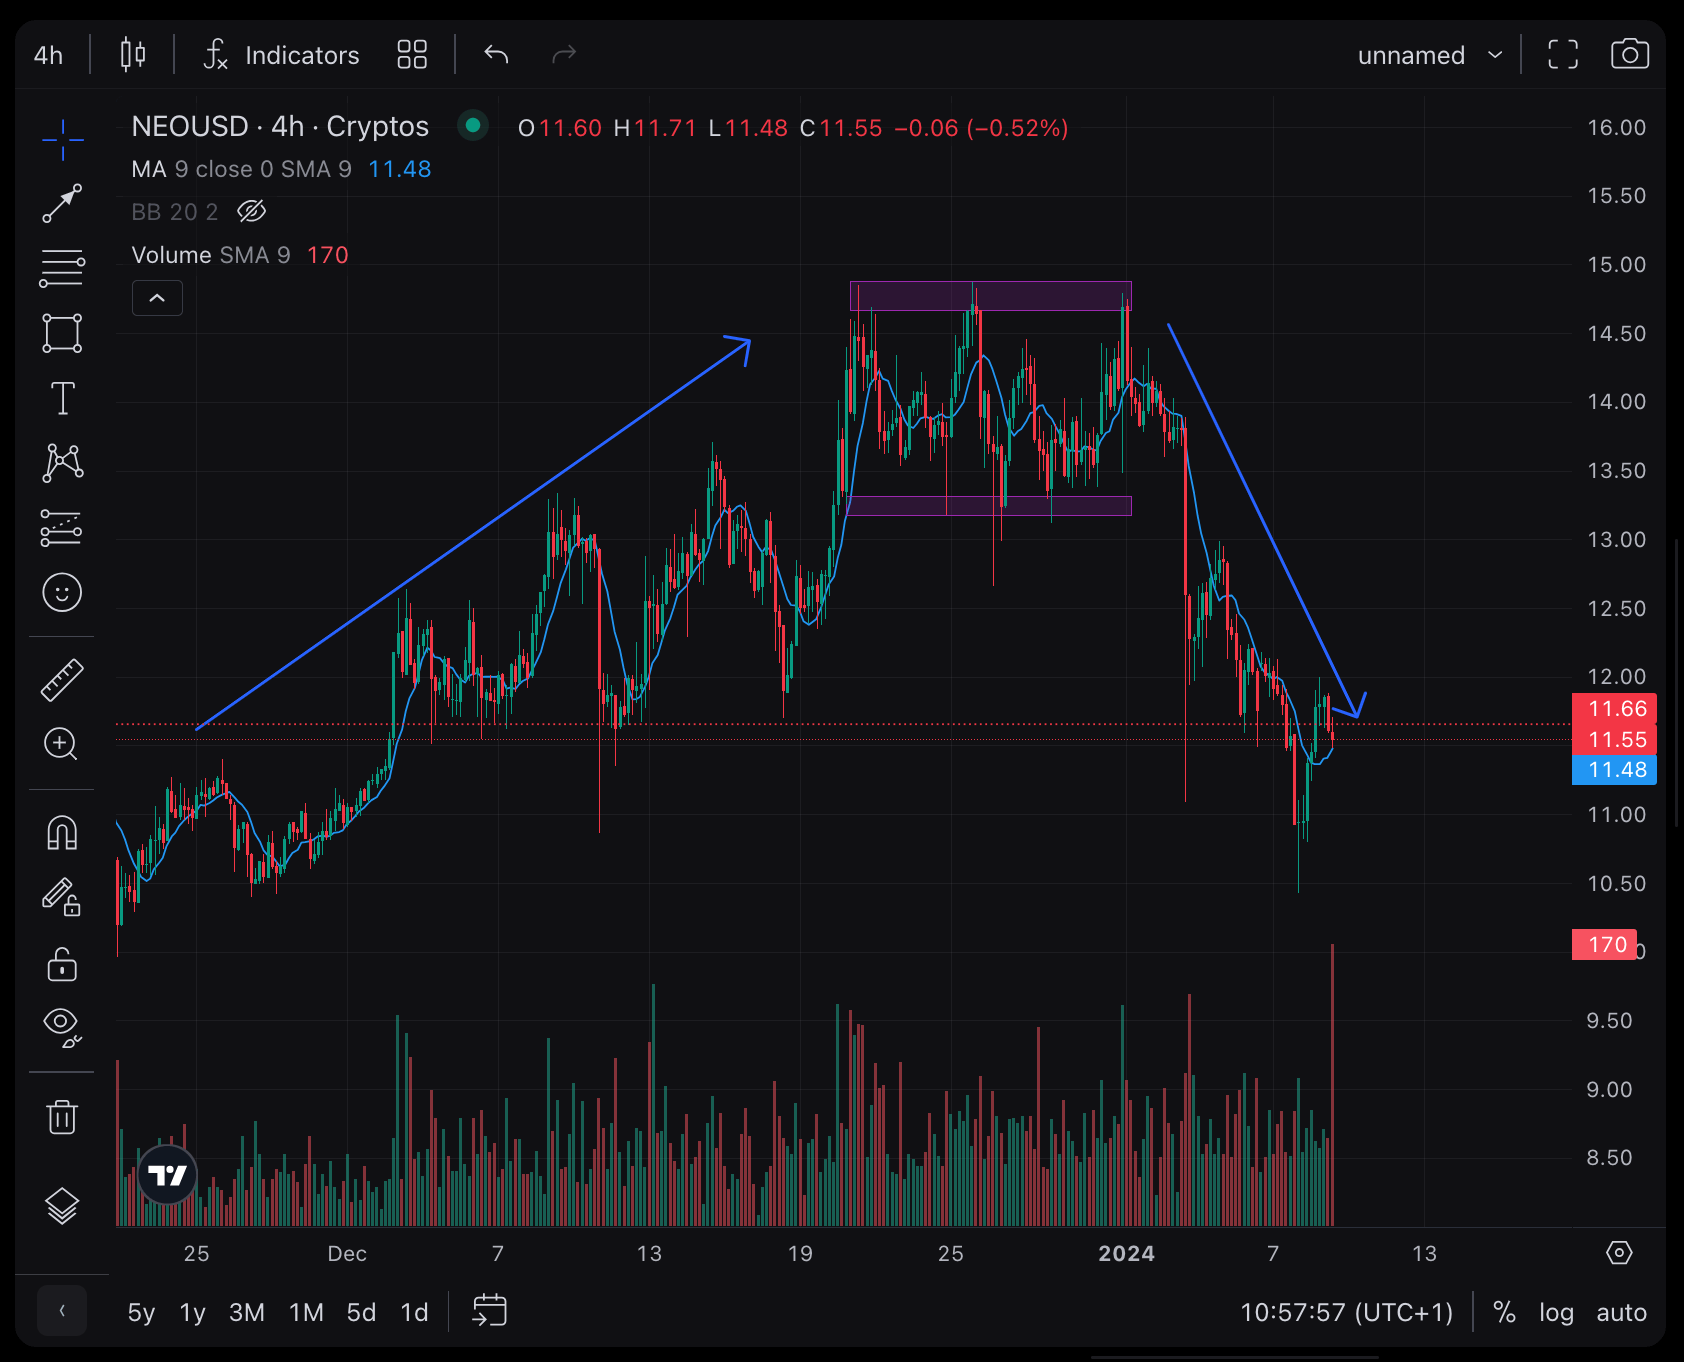
3. A Range Is Formed
The final feature of a bull trap setup is the formation of a range-like pattern at the resistance level.
A range implies that the price oscillates within a defined zone between support and resistance levels. This range formation might not be perfectly symmetrical, particularly on the upper side, as the market may continue to create marginally higher highs.
The onset of the bull trap is identifiable when the large bullish candle, as previously discussed, forms and closes outside of this range.
If you examine the following image, you will observe how a range pattern develops prior to the trap being sprung.
Example of a Bull Trap
In a typical scenario, an asset hits a new low before suddenly rallying. Many investors, anticipating a positive breakout, invest but get caught when the price reverses direction. Effective risk management strategies could minimize losses for those caught in this situation. Waiting for the breakout to fully materialize or setting a tight stop-loss can help mitigate the impact.
Example #1: The Rejected Double-top
The rejected double-top pattern features two prominent candlesticks that mirror a standard double-top pattern, with a key distinction: the second candle exhibits significant rejection at the top.
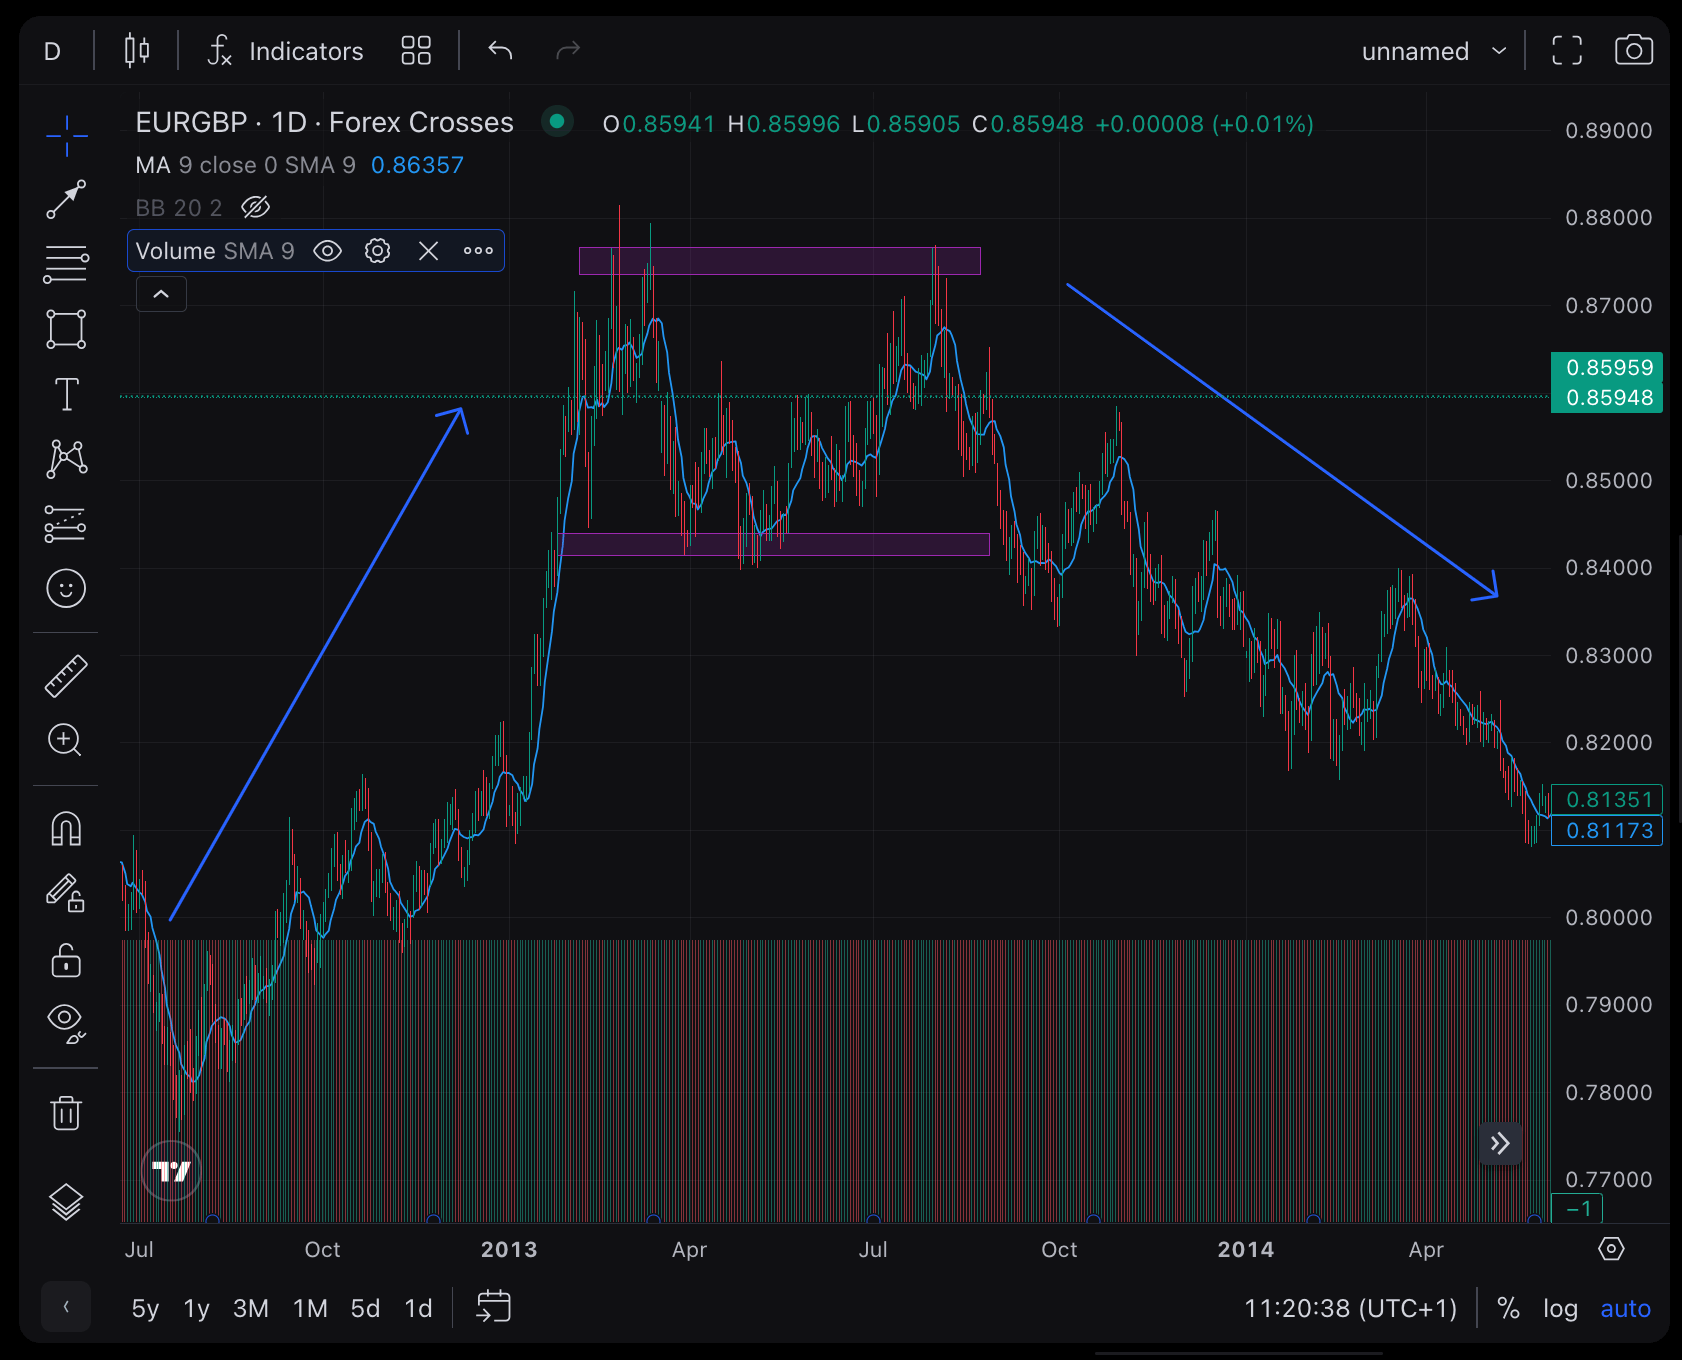
From the described image, the double-top pattern is easily identifiable. Its visibility and strength are further enhanced by the presence of a large wick on the candle that finalizes the pattern. This pronounced wick signifies that although buyers attempted to elevate the price, sellers quickly intervened and overpowered them, leading to the formation of the long wick.
In this example, the combination of the range-like behavior at the resistance level and the substantial bullish candle is evident. Hence, it aligns with the characteristics of an ideal bull trap formation.
Example #2: The Bearish Engulfing
Candlestick patterns and formations play a crucial role in pinpointing potential market turning points.
They are equally vital in recognizing and confirming a bull trap formation. When an engulfing pattern appears following the classic bull trap setup, it serves as a clear sign of an impending strong bearish movement.
In this case, a Doji candlestick, indicative of market indecision, appeared at the observed resistance level. Following the Doji, a large bearish candlestick emerged. This sequence suggests that the Doji symbolizes a intense battle between buyers and sellers. The subsequent formation of a strong bearish candle indicates that the buyers have been overpowered and the sellers have gained full control.
It’s important to note that there are numerous valid bearish candlestick formations that can signify the completion of a bull trap pattern. Therefore, a skilled trader should be adept at identifying these formations in crucial areas.
Example #3: The Failed Re-Test
Astute traders recognize this as a critical juncture for assessing the sustainability of a trend following a breakthrough of a major support or resistance zone.
Specifically, if the price breaches the resistance level but then retests it and is unable to maintain upward momentum, it sets up another classic bull trap scenario.
In the described Gold chart, we observe the formation of a bull trap at a resistance level. The price made a second attempt at the zone, breaking through it. This may have led impatient or less informed traders to perceive it as a continuation of the bullish trend, prompting them to take long positions.
Conversely, the more seasoned traders waited for the price to revisit and test the resistance zone again. True to their anticipation, the price did retrace for a retest. However, instead of bouncing back up, it entered a ranging phase, encountered significant upper rejections, and then sharply declined.
This sequence of events resulted in the formation of a textbook bull trap.
How to Avoid the Bull Trap?’
1. Beware of Late Entries
Given the characteristics of a bull trap, an extended, sustained uptrend often signals a potential for this deceptive pattern. Essentially, the longer an uptrend persists, the higher the risk of encountering a trap.
To avoid falling into bull traps, traders should be cautious of entering a trend too late. If a trend has been active for what might be considered “too long,” it’s generally safer to avoid trading in it.
Astute traders, both buyers and sellers, are aware that less cautious traders tend to enter trades during pullbacks. These experienced traders often capitalize on this by reversing the trends unexpectedly, thus trapping the late entrants.
2. Don’t buy at resistance levels
One of the most popular adages in trading is to “trade with the trend.” The ideal way to embody this principle is by buying at support levels and selling at resistance zones.
Respecting this concept implies that traders should generally avoid initiating buy trades at resistance levels. There are exceptions, like if the price re-tests the zone after breaking through it and confirms the onset of a new trend.
However, in most cases, it’s riskier to buy at resistance levels compared to purchasing at support zones. This approach aligns with the strategy of trading with the trend and mitigates the risk of encountering adverse market movements.
3. Wait for Re-Tests
Indeed, there’s no hard and fast rule that buying at resistance-zones-turned-support is incorrect. Traders understand that a support zone becomes a resistance zone once it’s breached, and similarly, a resistance zone turns into support after it’s successfully broken.
In essence, a prudent approach for traders is to wait for the price to not only breach a resistance zone but also to retest it and demonstrate upward momentum before placing buy orders.
In fact, buying during the retest phase usually means entering the trade at a lower point compared to initiating it at the peak of the breakout candle. This strategy potentially reduces the amount of money at risk if the trade turns out to be a loss. It’s a more cautious approach that takes into consideration the possibility of a bull trap or other market reversals.
4. Observe Price Action
Traders can sidestep bull traps by paying close attention to price action, which reflects the real-time movement and behavior of the price.
When observing a bullish rally approaching a resistance level, it’s crucial for traders to monitor how the price behaves. Key observations include:
- Formation of Shorter Candlesticks: When the price reaches a resistance zone and starts forming shorter candlesticks, it often indicates a lack of volume and momentum to support further upward movement. This is not an ideal time for trading.
- Presence of Longer Bearish Candles: If longer bearish candlesticks start appearing, accompanied by shorter bullish ones, it suggests that bears are gaining control over the market direction. In such a scenario, it’s advisable not to engage in buy trades.
- Candlesticks with Long Upper Wicks: Candlesticks at the resistance level that have long upper wicks indicate that bears are actively resisting further price increases. Any buy trades initiated in this context may only be profitable briefly before the price is driven down, potentially leading to trapped positions.
Conclusion
Bull trap patterns, notorious for enticing traders into risky positions that often result in losses, tend to evoke apprehension among many in the trading community.
However, with a clear understanding of how bull traps form and their implications, they can be transformed into opportunities for profit. Throughout this discussion, we’ve explored methods to identify and navigate bull traps, focusing on risk minimization and potential gain maximization.
This insight underscores the fact that the market can be quite rewarding, provided traders possess the skills to accurately interpret and respond to its dynamics. By learning to recognize and adeptly handle scenarios like bull traps, traders can better position themselves for successful market engagements.