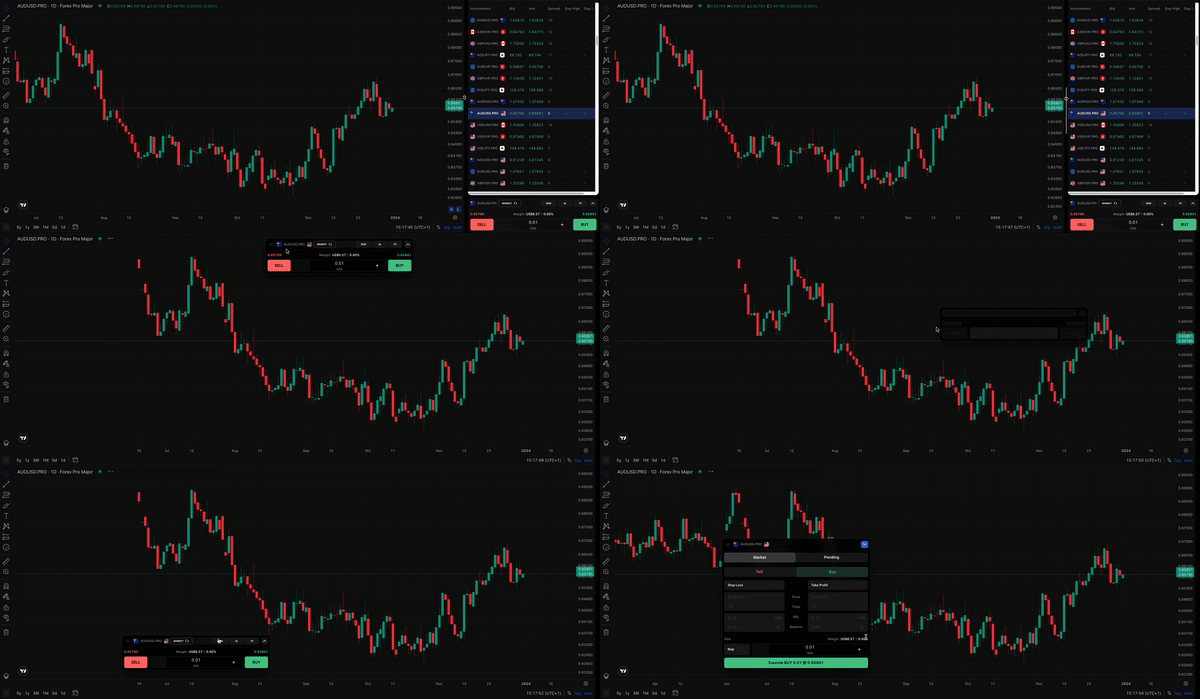
Using full-screen charts allows you to maximize your view of the price action and indicators. That way, you can do a more detailed analysis of the market.
Here’s how to use full-screen charts on TradeLocker.
Step 1: Full-screen icon
Look on the top right of the chart and you’ll find that the full-screen mode icon is represented by the full-screen icon.

Step 2: Expand the chart
You can also collapse the instrument panel to get a full view of the chart.
Simply click on the white line in between the chart and the instrument list and the chart will expand. That way, you can enjoy a full chart view with a floating order panel positioned wherever you need it.
You can move it by dragging it anywhere on the chart.

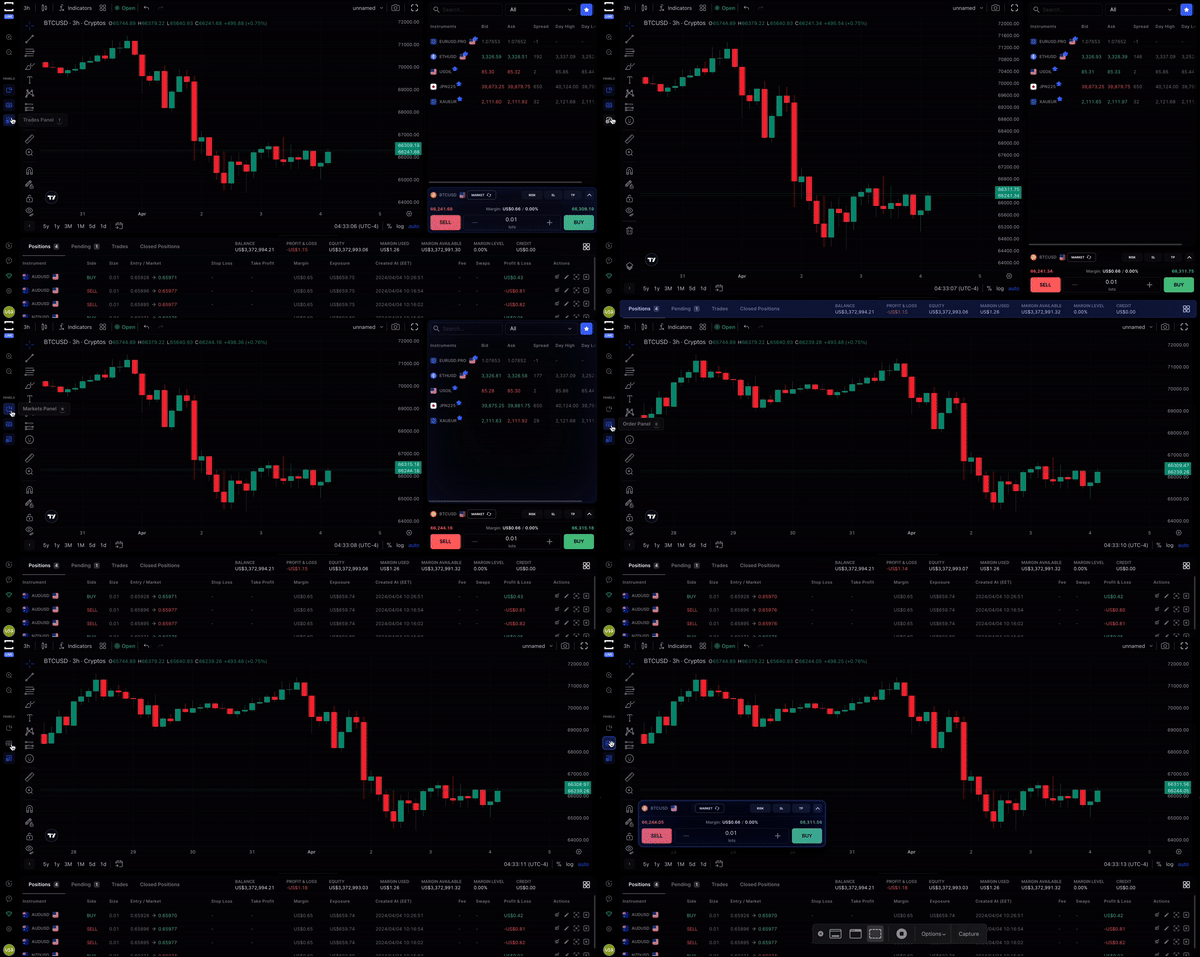
Step 3: Hide other panels
Navigate to the side panel on the left side of the platform and simply hide the Markets and Trades panels. Or simply press the hotkeys M and T on your keyboard to hide these panels.
For an even better view, you can hide the floating order panel by pressing O on your keyboard.

If you want to enjoy the full-screen chart view and switch the instrument, here’s how to do it with shortcuts.
Full-screen charts also provide the advantage of more easily spotting divergences between indicators and price action. This is vital for predicting future price movement.
Learn more here:
Help us build the perfect trading platform that prioritizes your needs and preferences. Join our Discord community to meet the TradeLocker team and other traders, discuss upcoming features, and chat with us directly.
