Now, you can view your trading history directly on the chart. Here’s how to get started:
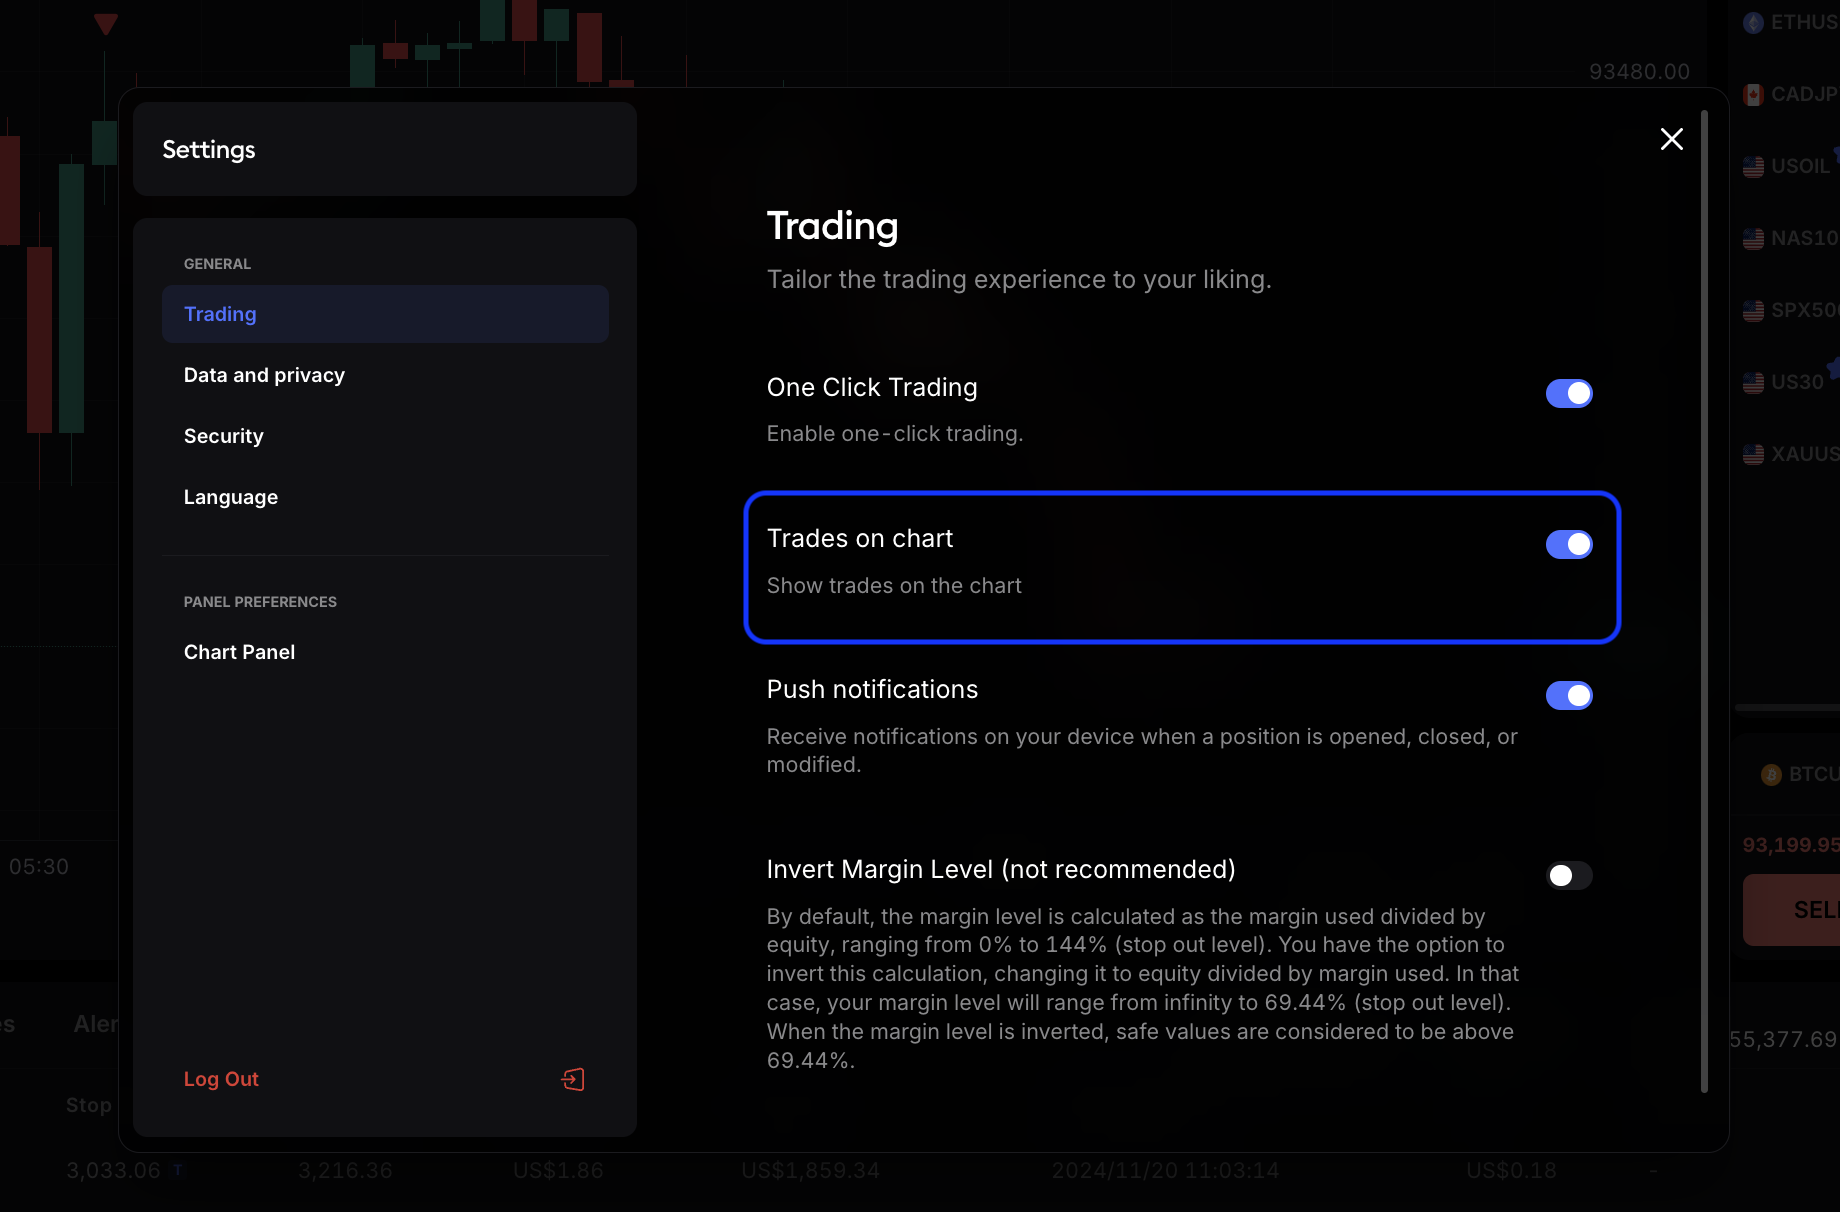
Step 1: Enable Trades on the chart
You can enable or disable this feature:
- Go to Settings.
- Click on Trading.
- Turn on the Trades on the Chart option.

Step 2: Select an instrument
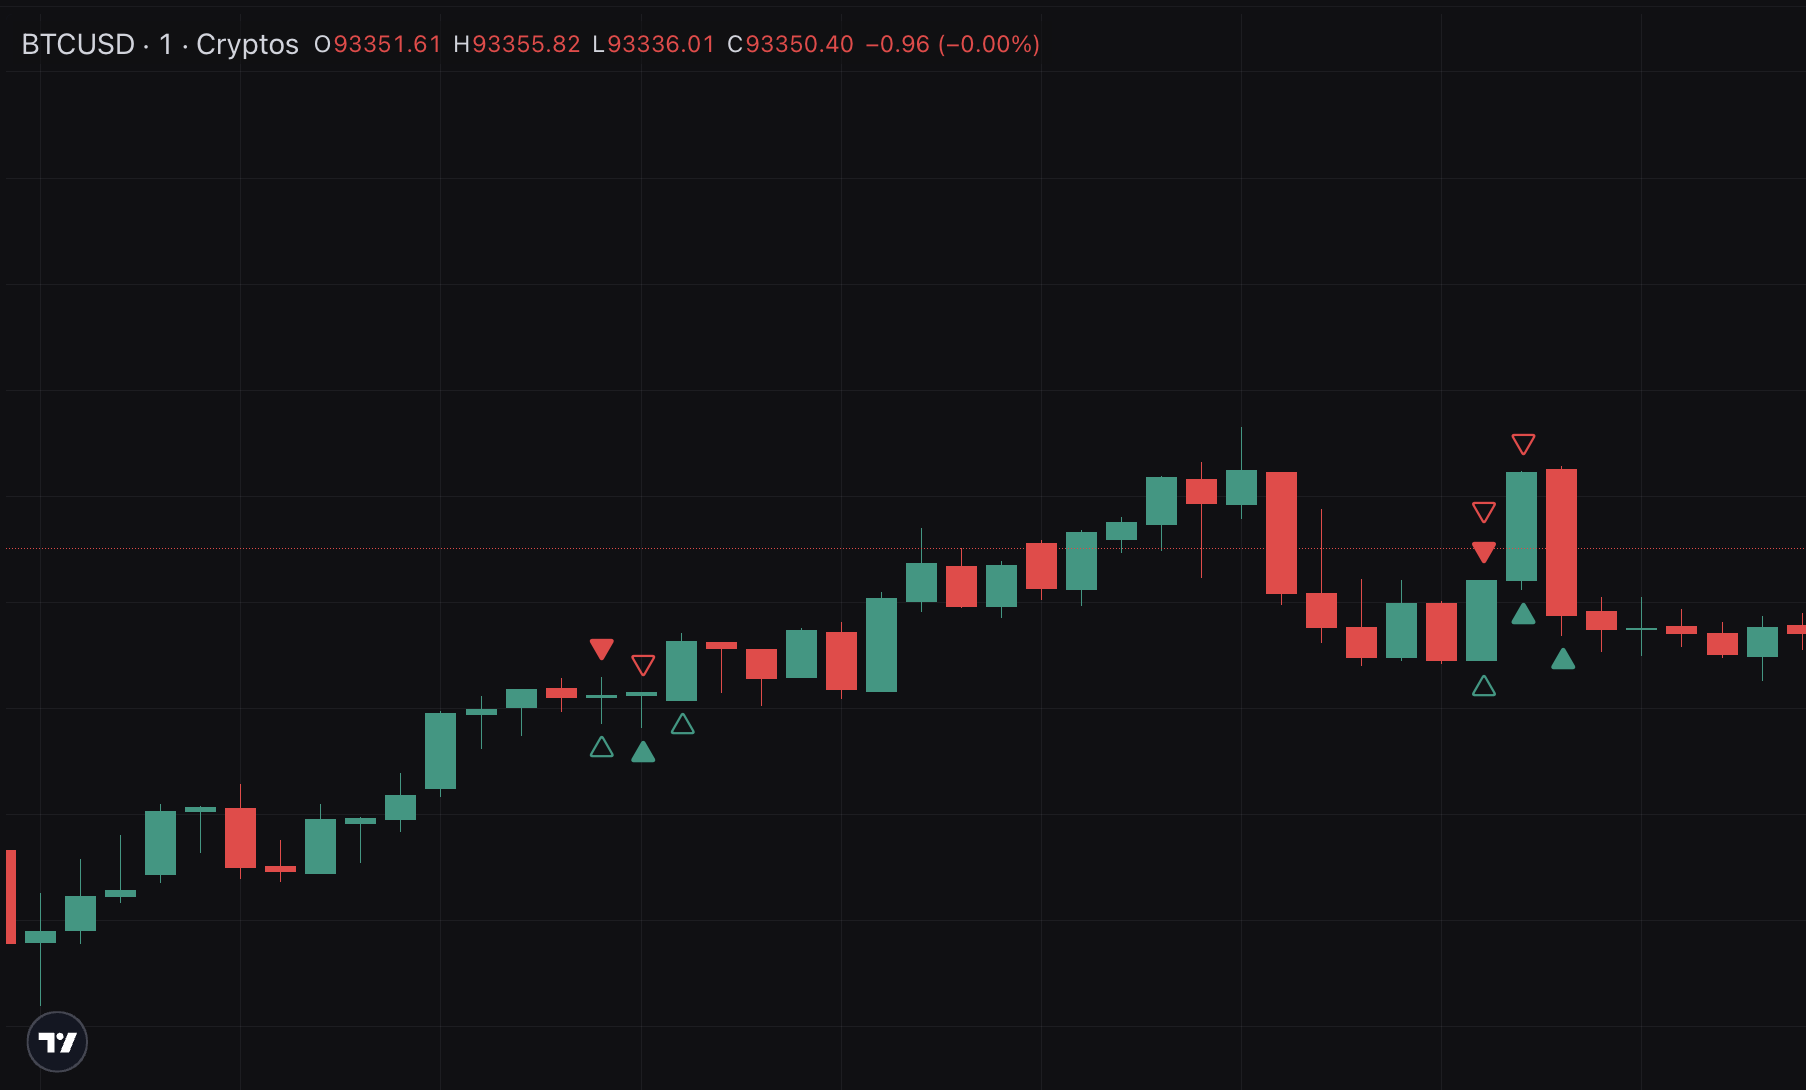
Once enabled, you’ll see all your past trades for the selected instrument displayed directly on the chart.
Note: This feature is available on minute and hour time frames for easier overview.

Step 3: Analyze your trading history
Easily differentiate between open and closed positions:
- Open positions: Shown as empty execution arrows in green or red.
- Closed positions: Shown as filled execution arrows in green or red.
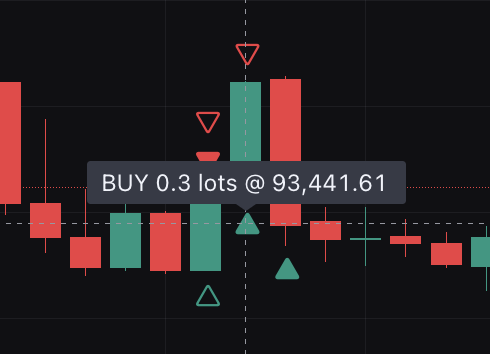
Hover over the execution arrows to view specific details about each position.

This feature is designed to make analyzing your trades faster and easier.
Learn more here:
Help us build the perfect trading platform that prioritizes your needs and preferences. Join our Discord community to meet the TradeLocker team and other traders, discuss upcoming features, and chat with us directly.
