Which charts does TradeLocker support
Changing your chart style in TradeLocker can affect your trading experience and outcomes. You can easily change your chart to any of the available chart styles:
- Bars
- Candles
- Hollow candles
- Columns
- Line
- Area
- Baseline
- Heikin Ashi
Press the chart icon
Just click on the style icon above the chart in the left corner next to the Indicators, and choose your preferred style.
Stylize your chart
If you want, you can add more changes to your charts. Just right click anywhere on the chart (or double tap if using your mobile phone), choose Settings and customise it using the menu.
And that’s it! You can also share your charts after you’re done customizing. 🙂
How to change the chart style on mobile
Tap the chart syle icon in the upper left corner of the screen. A pop-up will appear where you’ll be able to select the desired chart style.
How chart style affects your analysis
The choice of chart style on TradeLocker significantly impacts the kind of analysis you can conduct, which in turn, affects your trading strategies and decisions. Here’s a deep dive into how different chart styles can be instrumental in analyzing market trends and data:
Bars
Bar charts provide a clear visualization of price movements over a period, displaying opening, closing, high, and low prices for each time interval. This granularity is crucial for traders who engage in technical analysis as it allows for the identification of trends, comparisons of price actions across different time frames, and the spotting of potential buy and sell signals.
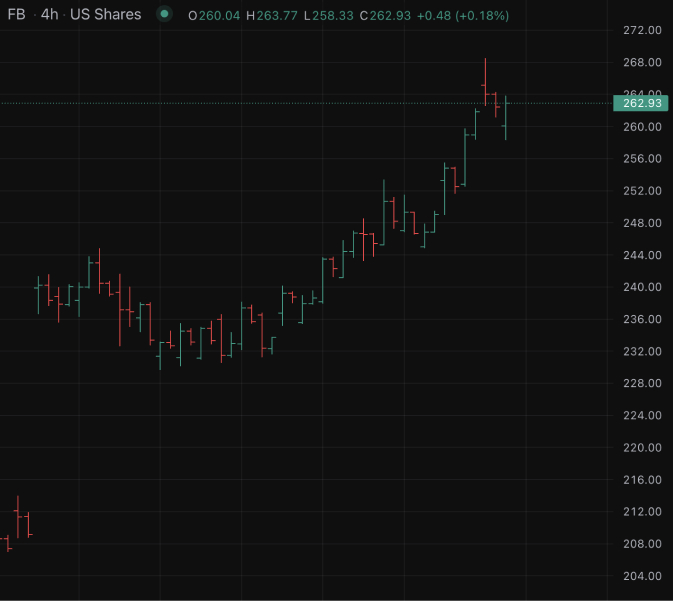
Candles
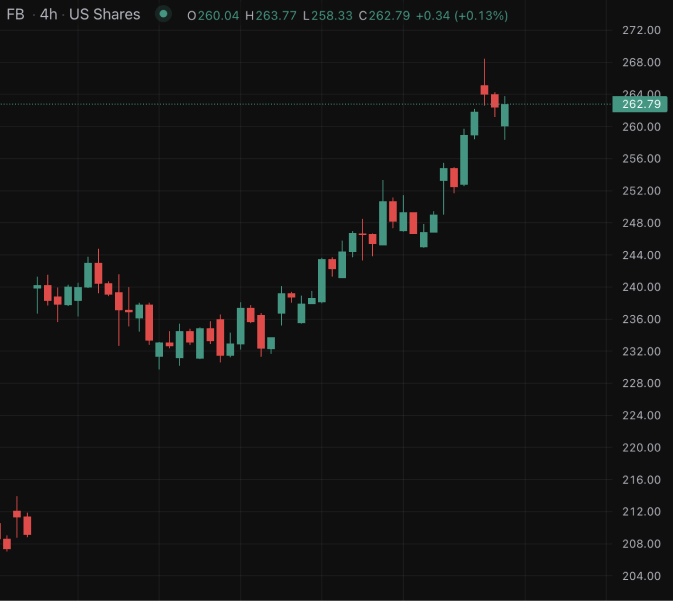
Candlestick charts offer a graphic representation of price movements, similar to bar charts but with a more visual distinction between bullish and bearish periods through color-coding. They are invaluable for identifying market sentiment, support and resistance levels, and various pattern formations which can signal future price movements.
Hollow Candles
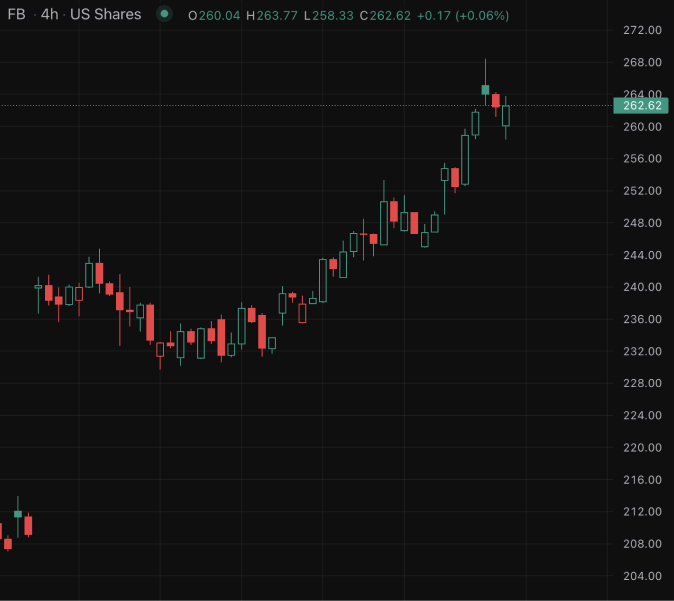
Hollow candle charts enhance visual clarity by filling bullish candles hollow and bearish candles solid, making it easier to discern market trends at a glance. They retain the benefits of traditional candlestick charts while offering a cleaner look that some traders prefer.
Columns
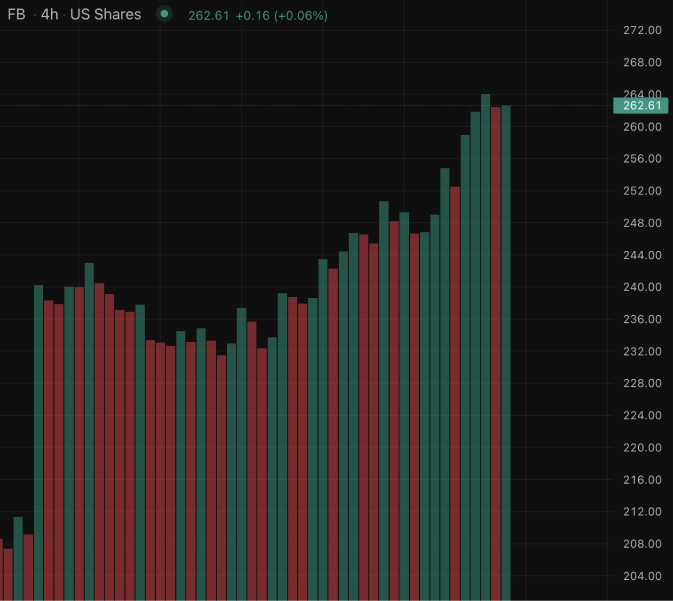
Column charts are useful for showing data changes over a period, making them great for visualizing volume or other single-dimension data points. They can help traders identify periods of high activity or stagnation in the market.
Line
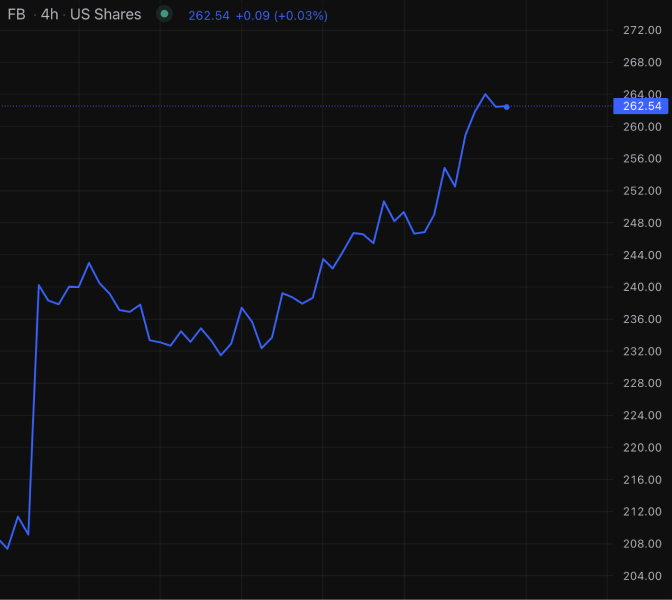
Line charts provide a simplified view of price movements by connecting closing prices over a period. They are excellent for getting a quick sense of overall price trends and are often used to identify broader market trends over longer timeframes.
Area
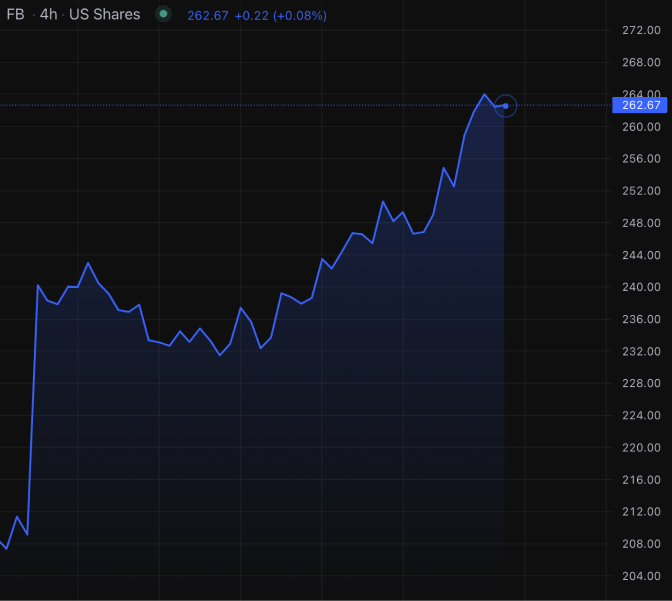
Area charts are akin to line charts but with the area below the line filled in, offering a visual representation of volume as well as price changes. They are useful for understanding overall trends and comparing the relative performance of multiple assets.
Baseline
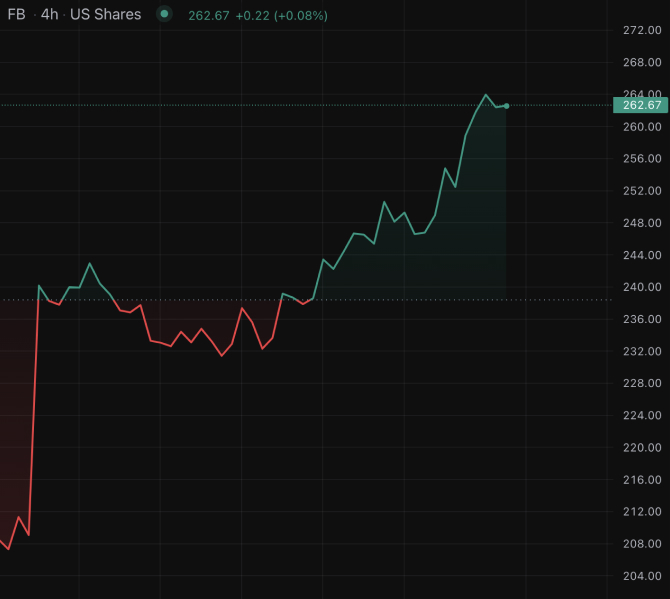
Baseline charts focus on relative performance by normalizing different datasets to a common baseline. They are crucial for comparing the performance of various assets or market indices, helping traders make informed decisions.
Heikin Ashi

Heikin Ashi charts are a variation of candlestick charts, smoothing out price data to help traders identify market trends and potential reversals. They are particularly useful for traders looking to minimize noise and focus on longer-term trends.
Learn more here:
Help us build the perfect trading platform that prioritizes your needs and preferences. Join our Discord community to meet the TradeLocker team and other traders, discuss upcoming features, and chat with us directly.
