Chart settings
Settings help you tailor your trading experience to your liking.
Step 1: Navigate to settings
Navigate to the Settings icon on the sidebar (bottom left side of the screen) and click on it.
Step 2: Chart panel preferences
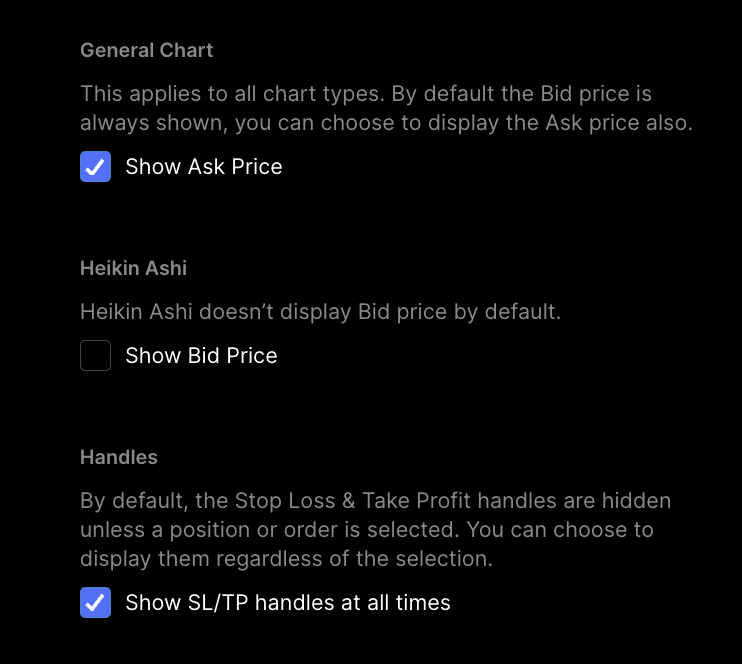
A popup will appear where you can adjust your settings. The Chart panel section allows you to customize what you see on the chart:
- Ask price: By default, the bid price is always shown and you can choose to display the ask price too.
- Bid price: Heikin Ashi doesn’t show the bid price by default so you can set it here.
- SL/TP handles: They are hidden unless a position/order is selected. Here, you can choose to display them regardless of the selection.
Bear in mind that any changes you make here will be applied across devices.
Step 3: Customize your chart appearance
Default chart settings
By default, the chart loads as a candlestick chart.
The color of the candlestick (often red or green) indicates whether the asset closed higher or lower than its opening price.
Customize candles and colors
If you want to change what your chart looks like, go to the candle icon dropdown menu and select the type of chart you want. You can choose between eight different types of charts, including bar charts, candlesticks and line charts.

To change any of the chart settings including information shown and color preferences:
- Right-click on the chart
- Go to settings
Chart settings available:
- The symbol tab: Change the color of the candles.
- The status line tab: Change what information is shown in the top left corner of the chart.
- The scales tab: Change settings related the chart scales.
- The appearance tab: Change the color of the chart itself, background, grid and scales.
Learn more here:
Help us build the perfect trading platform that prioritizes your needs and preferences. Join our Discord community to meet the TradeLocker team and other traders, discuss upcoming features, and chat with us directly.
